
Paddle, Rafting and Eco-Tours in the Southeast: Demand and the Booking Edge
Paddling, rafting and eco-tours are three different businesses that share one thing: many guests decide on a phone, close to the date, and book whoever makes it easy. They are also unusual among the outdoor industries we track because they are not licensed the way hunting and fishing are. License counts, our usual measure of demand, do not apply. Our 2026-27 Paddle, Rafting and Eco-Tours report uses the national accounts and the National Survey instead, then reads how 370 audited operators present themselves online.
Here is what it found, what it means, and what to fix first. Every number comes from the report and its public sources.
What the Paddle, Rafting and Eco-Tour Report Found
The Bureau of Economic Analysis (BEA) reports water-based guided tours and charters as its own line within outdoor recreation. That line rose from $8.7 billion in 2019 to $16.9 billion in 2024, an increase of 94%. It dipped slightly in 2020 ($8.4 billion) and has risen every year since. Boating and fishing, the larger line, grew 39% across the same five years, so guided trips are gaining on the boat-owning side of the water economy. The line is broader than paddling alone, so it is the closest public measure of this industry rather than a count of it.
The 11 Southeastern states hold about 21% of it. BEA's state estimates for this line are for 2023, when the 11 states produced $3.2 billion of the U.S. total of $15.2 billion. Florida leads at $1,185 million, followed by North Carolina ($403 million) and Georgia ($375 million). The line is the biggest share of outdoor recreation value added in Mississippi (3.7%) and the smallest in Arkansas (1.0%).
Eco-tours draw on a different kind of demand. The 2022 National Survey of Fishing, Hunting, and Wildlife-Associated Recreation counted 148.3 million Americans 16 and older who watched wildlife, 57% of that age group, with spending of $250.2 billion. The East South Central states reported the highest division participation rate, 66%. Wildlife watching in the survey covers observing, feeding and photographing wildlife, including near home. It measures interest, not the number of people who bought a guided tour, so it is the pool eco-tour operators draw on, not the size of their market.
Guided Trips Against Boating and Fishing
The growth is worth putting in numbers an owner can use. BEA's line for water-based guided tours and charters was $8.7 billion in 2019, dipped to $8.4 billion in 2020 and then rose every year to $16.9 billion in 2024, up 94%. Boating and fishing, the larger line, grew 39% over the same five years. In plain terms, guided trips are gaining on the part of the water economy that belongs to boat owners, so the guest who pays for a trip rather than owning the gear is a growing buyer.
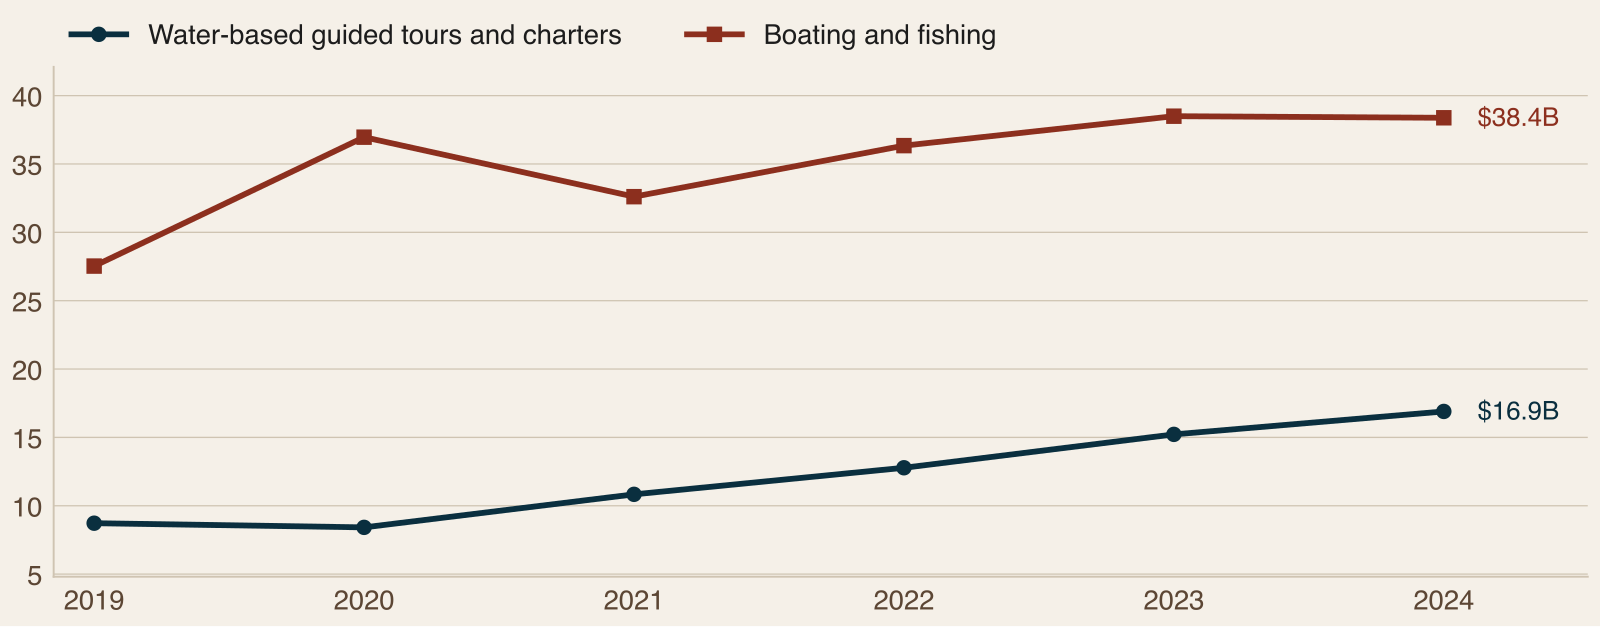
The report is careful about what this is. The line is broader than paddling alone, so it is the closest public measure of the industry and not a count of operators or their revenue. State detail is for 2023 only, from an older BEA release, so it is not joined to the 2024 national figure.
State by State: Guided Tours and the Audit
In 2023 the 11 states produced $3,206M of this line, 21% of the U.S. total of $15.2 billion. Florida produced $1,185M (2.1% of its outdoor recreation value added), North Carolina $403M (2.5%), Georgia $375M (2.0%), Tennessee $283M (2.2%), Virginia $259M (1.9%), South Carolina $195M (2.3%) and Louisiana $154M (1.7%). Mississippi produced $147M, but that was 3.7% of its outdoor recreation value added, the biggest weight of any state. The smaller lines were Alabama ($89M, 1.4%), Kentucky ($72M, 1.3%) and Arkansas ($43M, 1.0%). The report reads the high weights as states where the water itself, rather than the woods, is the draw.
The audit counts sit beside those figures. North Carolina has 60 audited operators in these categories (25% of its audited operators), Virginia 50 (34%), Louisiana 44 (30%), Tennessee 42 (26%), South Carolina 31 (23%), Florida 30 (26%), Georgia 29 (21%), Alabama 25 (18%), Arkansas 24 (17%), Kentucky 21 (21%) and Mississippi 14 (16%). Florida shows how little the two measures line up: only 30 audited operators against the largest value added. A state with many audited operators is not necessarily one with a large guided-tour economy, and the audit sub-regions were designed around hunting, fishing and outdoor hospitality, so some paddling and tour businesses outside them are not in the sample.
Where operators were found by landscape: coast, bays and barrier islands sub-regions hold the most (149, or 40%), then mountains and foothills (106, 29%), rivers, deltas and wetlands (47, 13%), piedmont, plains and metro interior (37, 10%) and lakes and reservoirs (31, 8%).
Wildlife Watching, the Demand Behind Eco-Tours
The 2022 National Survey counted 148.3 million Americans 16 and older who watched wildlife, 57% of the 259 million people in that age group, with spending of $250.2 billion. The East South Central states reported the highest division participation rate, 66%. Only three of the 11 states published state-level results: Arkansas (2.7 million watchers and $7.1 billion), Georgia (7.5 million and $10.6 billion) and Kentucky ($6.4 billion, with watchers not reported separately). Spending includes equipment and trips, and the survey is for 2022, the most recent edition. For an eco-tour operator this is the pool of interest, not a market size.
Three Different Businesses
Our October 2026 audit verified 1,546 private operators. Of those, 370 (24%) are paddle, whitewater or eco-tour businesses, found in 85 of 97 sub-regions: 231 paddle, kayak and canoe operators (rentals, guided paddles, tubing and floats), 38 whitewater rafting outfitters, and 101 eco-tour and wildlife-viewing operators (swamp, airboat, dolphin and nature tours). The sample is structured, not a census.
On mean digital health, our 1 to 10 score from observed evidence, the group scores 5.66 against 5.09 for all audited operators, and 28% score 4 or below against 40%. The three categories differ:
Whitewater rafting leads at 6.55, with 34% scoring 8 or above.
Eco-tours and wildlife viewing score 6.00.
Paddle, kayak and canoe score 5.36, pulled down by many small rental and guide businesses.
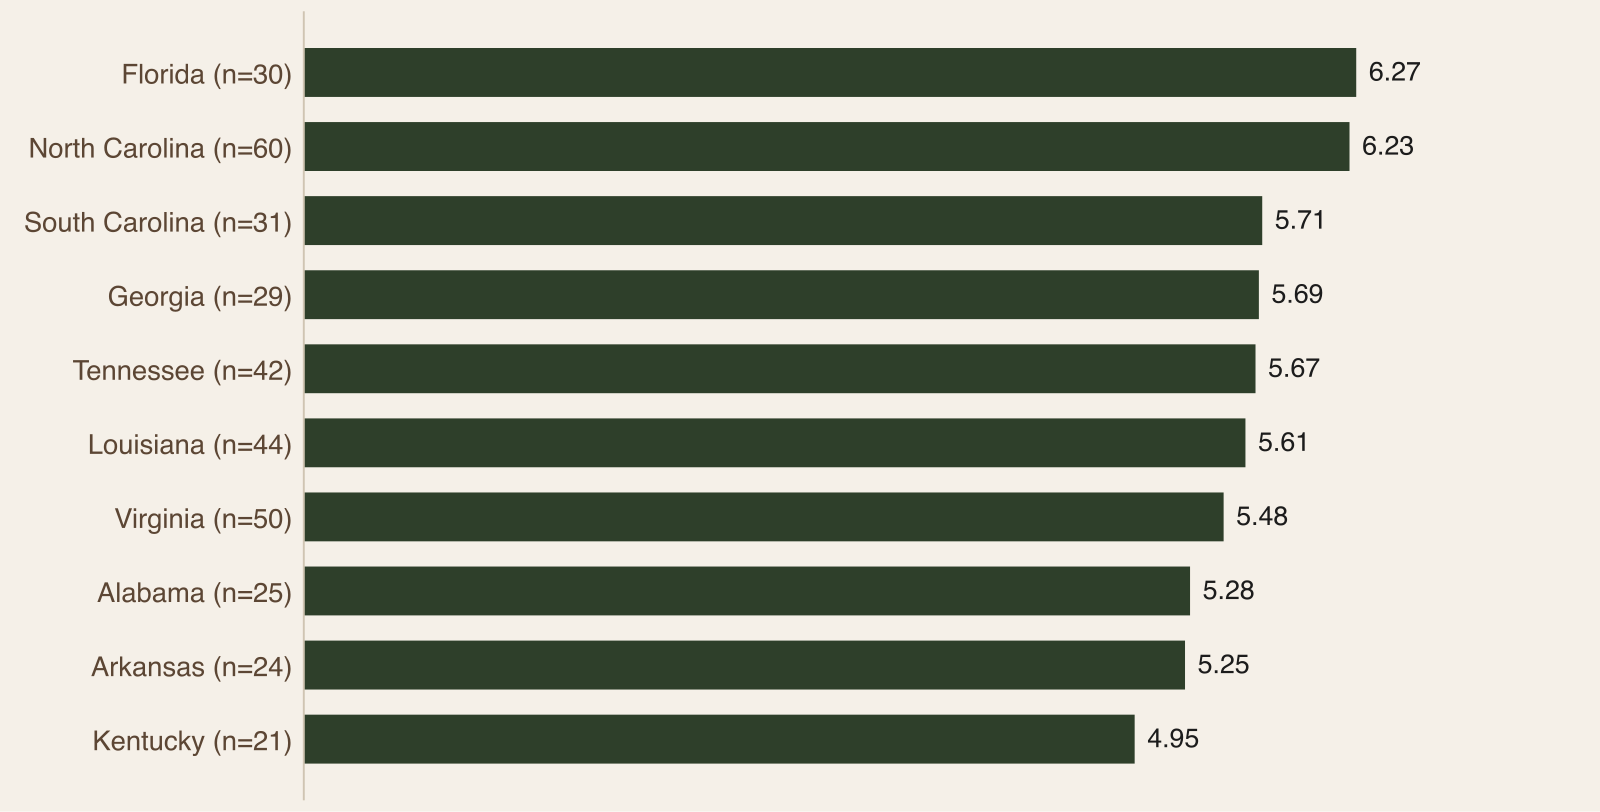
By state, among the ten states with enough operators to compare, Florida is highest at 6.27 and Kentucky lowest at 4.95. Treat differences smaller than half a point as noise at these sample sizes.
The Three Businesses in Numbers
Paddle, kayak and canoe has 231 operators, 93% with their own website, a mean of 5.36, 32% scoring 4 or below, 13% scoring 8 or above and 187 sites read. Whitewater rafting has 38 operators, 95%, 6.55, 13%, 34% and 35 sites read. Eco-tours and wildlife viewing has 101, 94%, 6.00, 22%, 25% and 86 sites read. Combined, the 370 operators have 93% on their own website, a mean of 5.66, 28% at 4 or below, 18% at 8 or above and 308 sites read, against 80%, 5.09, 40% and 12% for all 1,546 audited operators.
State and Landscape Scores
Among the ten states with enough operators and sites to show, Florida (6.27, 30 operators) and North Carolina (6.23, 60) lead, followed by South Carolina (5.71), Georgia (5.69), Tennessee (5.67), Louisiana (5.61), Virginia (5.48), Alabama (5.28) and Arkansas (5.25). Kentucky is lowest at 4.95, with 76% on their own website and 48% scoring 4 or below. Mississippi has fewer than 15 audited operators and is left out of the comparisons. Differences smaller than half a point are noise at these sample sizes.
By landscape, coast, bays and barrier islands average 5.85 across 149 operators and mountains and foothills 5.83 across 106. Rivers, deltas and wetlands average 5.40, piedmont, plains and metro interior 5.27 and lakes and reservoirs 5.00 (81% with their own website, 42% scoring 4 or below). The groupings are broad and judgment-based, so read them as a pattern to check against your own market.
Booking Is the Edge
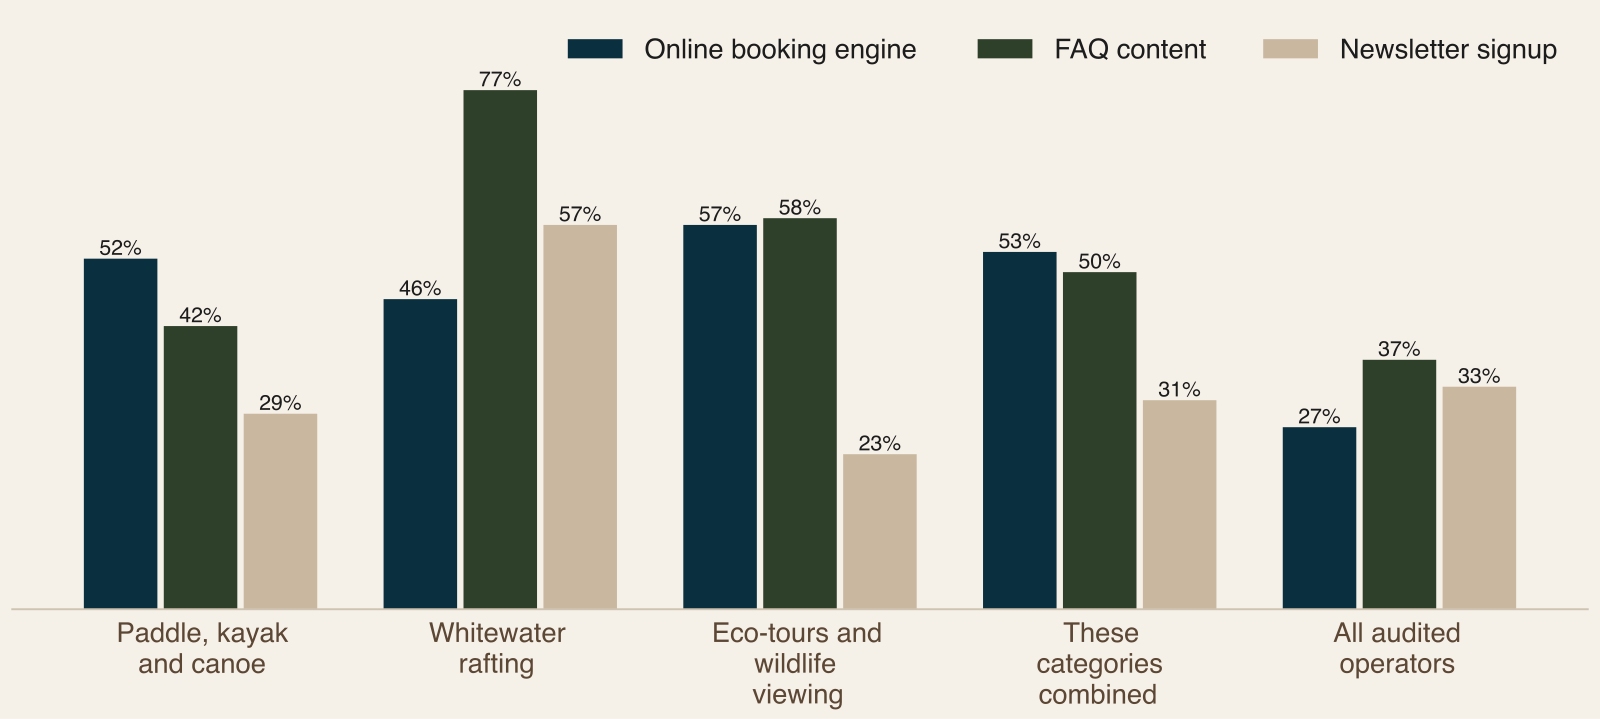
Online booking is the clearest difference. Of the 308 sites we could read, 53% show an online booking engine on the homepage, about double the 27% for all audited operators. Eco-tours are highest at 57%, then paddle at 52% and whitewater at 46%. Of the 163 sites with an engine, 119 (73%) use FareHarbor. Some sites use more than one platform.
Adoption varies. Among states with enough sites, it runs from 21% in Arkansas to 76% in South Carolina. By landscape it runs from 33% in lakes and reservoirs sub-regions to 62% in coast, bays and barrier islands sub-regions.
Even so, 47% of these sites show no booking engine. For a trip bought on a phone, that often means a lost sale.
The Signals by Category
The category table shows how uneven the picture is. Booking engines appear on 52% of paddle sites, 46% of whitewater sites and 57% of eco-tour sites. FAQ content is on 42%, 77% and 58%, newsletter signup on 29%, 57% and 23%, and some structured data on 64%, 80% and 73%. FAQ structured data is on 1%, 3% and 0%. A copyright year of 2023 or older appears on 19%, 17% and 18% of sites with a detectable year. Combined, the group shows 53% booking, 50% FAQ content, 1% FAQ structured data, 31% newsletter, 69% structured data and 18% stale years, against 27%, 37%, 2%, 33%, 67% and 25% for all audited operators.
Where an engine is present, FareHarbor is on 119 of the 163 sites that have one (73%), and some sites use more than one platform. Adoption by state runs from 21% in Arkansas to 76% in South Carolina, and by landscape from 33% on lakes and reservoirs to 62% on the coast. Those two spreads are the real news for an owner: the question is not whether booking works but whether it is on your homepage.
The Answer Layer Is Thin
Half of these homepages (50%) carry FAQ content, well above the 37% overall, and whitewater outfitters lead at 77%. That matters because the questions are practical: age and weight limits, skill level, what to wear, what happens in rain or high water, parking and shuttles. The gap is in how the answers are published. Only 3 of 308 sites mark them up with FAQ structured data, even though 69% have some structured data, much of it added automatically by website builders.
Newsletter signup is where the industry looks like everyone else: 31% against 33%. Whitewater is highest at 57% and eco-tours lowest at 23%. And 18% of sites with a detectable copyright year show 2023 or earlier.
What This Means for Operators
Demand is real, but the report is careful about what it does not show. BEA value added and survey spending measure different things and are never added. A state with many audited operators is not necessarily a state with a large guided-tour economy, because the audit counts a sample of businesses while BEA measures value added. The audit sub-regions were also designed around hunting, fishing and outdoor hospitality, so some paddling and tour businesses are not in the sample.
What the data does show is a booking gap. As general guidance, a guest looking at a river, a bay or a town plus "kayak rental" or "guided tour" wants four things: does the trip suit my group, what does it cost, is there room on my day, and will the weather and water allow it. A homepage that answers all four and lets them book on the spot does most of the work. Only 53% of the audited sites show an online booking engine on the homepage.
Where you operate also matters. Many paddling routes and wildlife areas run through national forests, national parks and other public waters. Commercial outfitters on national forests need a U.S. Forest Service special-use permit, and commercial outfitters in National Park Service units need NPS authorization, usually a commercial use authorization or, for some services, a concession contract. National wildlife refuges, state parks and state wildlife areas set their own rules, and some do not allow commercial guiding at all. Say plainly on your site where your trips run, and confirm the rules for each route with the managing agency before you sell it.
How Buyers Book, and When
The audit does not measure how buyers search, so this is general guidance. Buyers of a guided paddle, a raft trip or a wildlife tour tend to start with a place and an activity, then look for four things: whether the trip suits their group, what it costs, whether there is room on the day they want, and whether the weather and water will allow it.
Local and day-trip buyers decide close to the date, often when the weather looks right, so offer same-day availability, mobile booking and a clear cancellation rule.
Visitors from out of town plan around lodging and travel dates, usually earlier than locals, so publish dates and prices well ahead and make it easy to hold a spot.
Groups, events and schools inquire early and need a quote, a contact and sometimes a deposit, so give them a group page with capacity, minimums and a quick inquiry form.
Repeat guests rebook when reminded, so keep a newsletter list and a simple rebooking message.
The year runs in four phases plus a wildlife track. In winter buyers browse and plan, so publish next season's dates, prices and policies and test the booking flow end to end. In early spring first-timers ask about conditions, age limits and what to bring, so post an opening announcement and a conditions page and confirm permits and insurance paperwork. In peak season buyers book close to the date, often on a phone, so show live availability and keep a visible weather and water policy. In fall come cooler-weather trips and group and school outings. Many eco-tour products follow nesting, migration or blooms, so build a plain "what you can see, and when" page from your own guides' logs.
The pattern holds even where dates differ: most paddling and tour demand is warm-season, whitewater depends on rainfall and, on dammed rivers, on release schedules, and wildlife products follow animals, not months.
Practical Moves
Put booking on the homepage. A visible Book button with live dates is the single clearest difference between businesses in these categories and the audited average.
Write the practical answers once (age, weight, skill, what to wear, weather, parking) and publish them with FAQ structured data.
Publish a short conditions page and a plain rain, heat and high-water policy, and show it before checkout.
Start a list and use it. Past guests often return with friends and family, and a reminder when the season opens is the cheapest booking you will get.
Update dates, prices and photos each season, and show safety, guide qualifications and insurance clearly.
Make the booking path work on a phone first. A guest should be able to reserve in under a minute.
For the specifics of each business type, see our posts on marketing a river float, canoe and kayak livery, marketing a swamp tour and airboat operation and the Mulberry River whitewater outfitters.
Read the Full Paddle, Rafting and Eco-Tours Report
The full report has the state table, results by category and landscape, the booking platform breakdown, a seasonal booking calendar and six moves for operators.
Download the full 2026-27 Paddle, Rafting and Eco-Tours report (free with your email).
Sources
U.S. Bureau of Economic Analysis, Outdoor Recreation Economic Statistics, March 5, 2026 release (2024 data), and the Outdoor Recreation Satellite Account, November 2024 release (2023 state data)
Pine & Marsh outfitter audit, rebuilt and verified October 2026: 1,546 operators across 97 sub-regions, with website signals read October 17, 2026
Frequently Asked Questions
How fast is the guided water tour market growing?
BEA's water-based guided tours and charters line rose from $8.7 billion in 2019 to $16.9 billion in 2024, up 94%, with a slight dip to $8.4 billion in 2020 and growth every year since. Boating and fishing grew 39% over the same years. It is a national value added measure that is broader than paddling alone, not a count of operators or their revenue. The 11 Southeastern states produced $3,206M of the line in 2023, about 21% of the U.S. total, led by Florida at $1,185M.
Which type of operator scores best online?
Whitewater rafting outfitters, at 6.55 on our 10-point digital health scale with 34% scoring 8 or above, ahead of eco-tour operators (6.00) and paddle, kayak and canoe businesses (5.36). The paddle category is the largest, with 231 audited operators, and its many small rental and guide businesses pull the average down, with 32% scoring 4 or below. Combined, the three categories average 5.66 against 5.09 for all audited operators.
Why does online booking matter so much for paddle and tour businesses?
Guests often decide close to the date, on a phone, and ask about same-day room. In the audit, 53% of the 308 sites read show a booking engine, about double the 27% for all audited operators, and 47% still show none. Eco-tours are highest at 57%, then paddle at 52% and whitewater at 46%. A visible Book button with live dates removes the wait, and for a trip bought on a phone, a site with no way to book often means a lost sale.
Which booking platform do these operators use most?
Of the 163 sites with a booking engine, 119 (73%) use FareHarbor. Some sites use more than one platform, so the counts overlap. The audit records which platforms appear on the homepage, not how well they are set up. Adoption varies by state, from 21% in Arkansas to 76% in South Carolina among states with enough sites, and by landscape, from 33% on lakes and reservoirs to 62% on the coast, bays and barrier islands.
Does wildlife watching data tell me how many people will book an eco-tour?
No. The National Survey counts people who observe, feed or photograph wildlife, including near home, and 148.3 million Americans 16 and older did so in 2022, 57% of that age group. It measures interest in wildlife, not tour purchases, and its $250.2 billion of spending includes equipment. Only Arkansas, Georgia and Kentucky published state-level results in the data collected. Use it as the pool eco-tour operators draw on, not as the size of their market.
Do I need a permit to guide on national forest or national park land?
Yes. Commercial outfitters on national forests need a U.S. Forest Service special-use permit, and commercial outfitters in National Park Service units need NPS authorization, usually a commercial use authorization or, for some services, a concession contract. National wildlife refuges, state parks and state wildlife areas set their own rules, and some do not allow commercial guiding at all. Confirm the rules for each route with the managing agency before you sell trips, and say plainly on your site where your trips run.
How do the FAQ and newsletter numbers compare with the rest of the audit?
Half of these homepages (50%) carry FAQ content, well above the 37% overall, and whitewater outfitters lead at 77%. But only 3 of 308 sites mark answers up as FAQ structured data, even though 69% have some structured data, much of it added by website builders. Newsletter signup is 31% against 33% overall, with whitewater highest at 57% and eco-tours lowest at 23%. The structured-data gap is the cheapest lead an operator can build.
What should a paddle or rafting operator fix first?
Make the booking path work on a phone: the homepage should show what you sell, what it costs and when you have room, and a guest should be able to reserve in under a minute. Then write the practical answers once (age, weight, skill, what to wear, weather, parking) and publish them with FAQ structured data, add a short conditions page and a plain rain, heat and high-water policy, and keep a list of past guests so you can remind them when the season opens.


Comments