
Inside the 2026-27 Paddle, Rafting and Eco-Tours Report: State Scores, Booking Tools and Wildlife Demand
The 2026-27 Paddle, Rafting and Eco-Tours report is the thirteenth in our industry series. It covers paddle, kayak and canoe businesses, whitewater rafting outfitters, and eco-tour and wildlife-viewing operators across 11 Southeastern states. It combines public data from the Bureau of Economic Analysis (BEA) and the 2022 National Survey of Fishing, Hunting, and Wildlife-Associated Recreation with our October 2026 audit of 1,546 outdoor businesses, 370 of which fall into these three categories.
It is written for livery owners, rafting outfitters, tour captains and the people who market them. This post goes chapter by chapter and leans on the tables behind the headlines. For the summary and the marketing playbook, see Paddle, Rafting and Eco-Tours in the Southeast: Demand and the Booking Edge.
At a Glance: Nine Numbers
The opening chapter describes a fast-growing slice of the outdoor economy sold mostly through a handful of booking tools and a homepage. Its nine numbers are $16.9 billion of U.S. value added from water-based guided tours and charters in 2024, $3.2 billion for the 11 states in 2023, and 148.3 million Americans who watched wildlife in 2022. The audit adds the rest: 370 operators, 93% with their own website, a mean digital health score of 5.66, and booking, FAQ and newsletter rates of 53%, 50% and 31%.
The executive summary then names the two things operators should take away first. Online booking is the clearest difference from the rest of the audit, at roughly double the rate. And the answer layer is thin: 3 of 308 sites read use FAQ structured data. It also gives the geographic spread, from a mean score of 4.95 in Kentucky to 6.27 in Florida.
Demand: Who Is Buying
Paddling, rafting and eco-tours are not licensed the way hunting and fishing are, so the license counts that anchor other reports in the series do not apply. Two public sources step in. Neither counts the industry, and the report says so.
BEA reports water-based guided tours and charters as its own line, broader than paddling alone. It rose from $8.7 billion in 2019 to $16.9 billion in 2024, a 94% increase, with a slight dip to $8.4 billion in 2020 and growth every year since. Boating and fishing, the larger line, grew 39% over the same years.
Two state views sit under that national line, and they answer different questions.
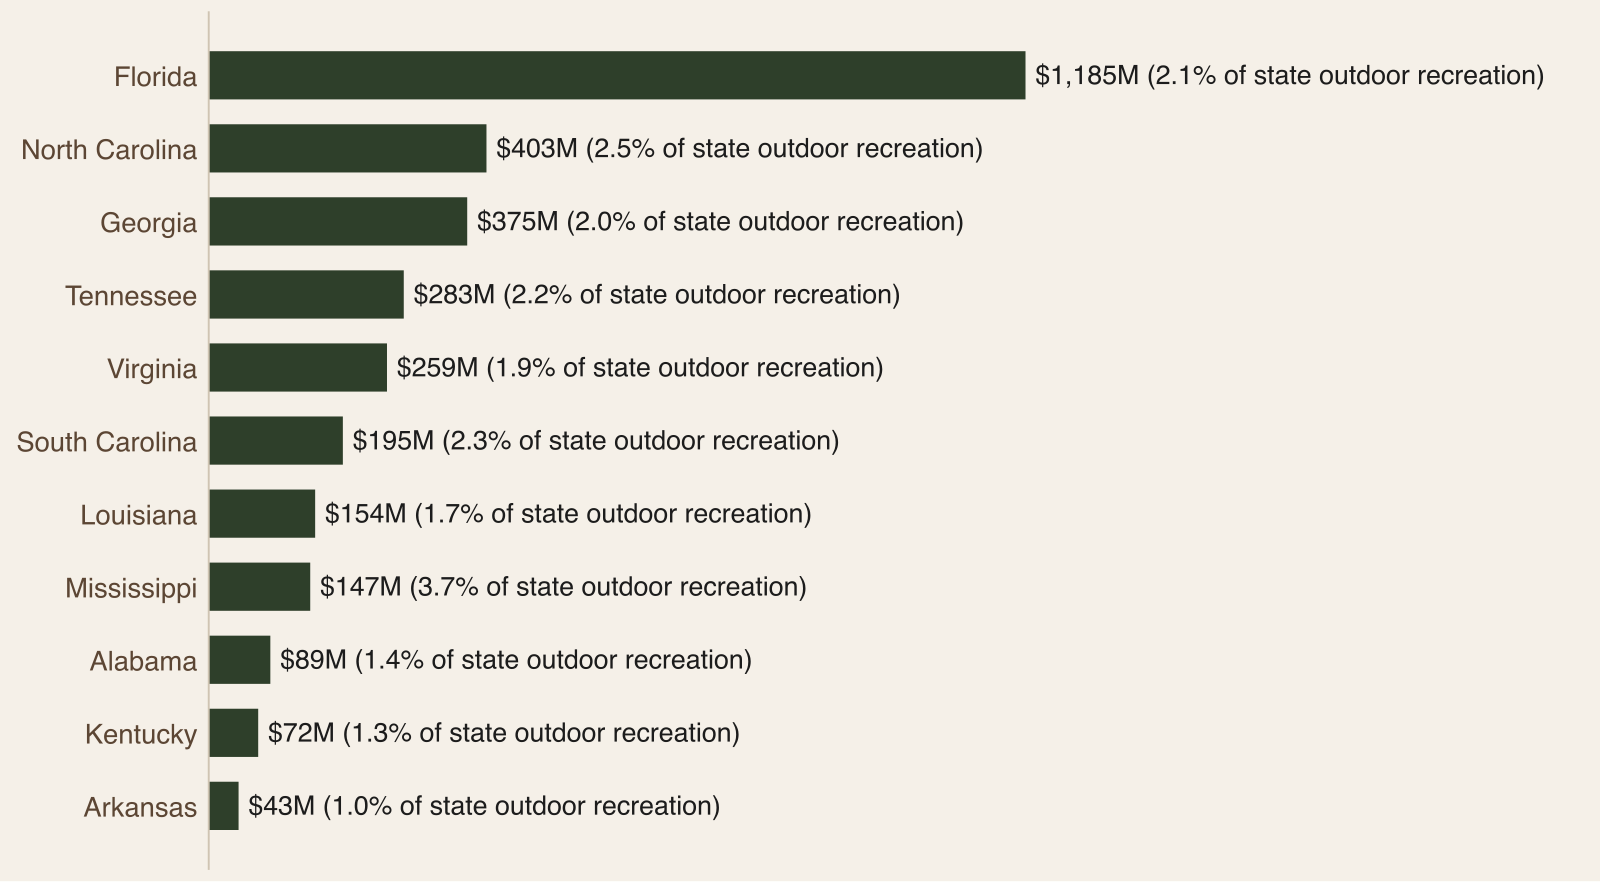
Guided tours by state (2023). The 11 states produced $3.2 billion, 21% of the U.S. total of $15.2 billion. Florida leads at $1,185 million, then North Carolina ($403 million) and Georgia ($375 million).
Weight in each state. The line is 3.7% of outdoor recreation value added in Mississippi and 1.0% in Arkansas. The report reads that as a sign that where the water is the draw, guided trips matter more to the outdoor economy.
The chapter then sets the larger frame: the 11 states together produced $176.7 billion of outdoor recreation value added in 2024.
The last section is wildlife watching, the demand behind eco-tours. The National Survey counted 148.3 million Americans 16 and older who watched wildlife, 57% of that age group, with spending of $250.2 billion. The East South Central states reported the highest division participation rate at 66%. Only three states published state-level results: Arkansas (2.7 million watchers and $7.1 billion), Georgia (7.5 million and $10.6 billion) and Kentucky ($6.4 billion, watchers not reported separately). The report is careful that wildlife watching includes feeding and photographing wildlife near home, so it measures interest and not tour purchases.
Some details in the demand chapter reward a second read. The national series runs $8.7 billion in 2019, $8.4 billion in 2020 and then up each year to $16.9 billion in 2024, with boating and fishing growing 39% over the same years. The state estimates are for 2023, from the November 2024 release. In that release the 11 states produced $3,206M. After Florida, North Carolina ($403M) and Georgia ($375M) come Tennessee ($283M), Virginia ($259M), South Carolina ($195M), Louisiana ($154M), Mississippi ($147M), Alabama ($89M), Kentucky ($72M) and Arkansas ($43M).
The weight column is more telling than the dollars: the line is 2.5% of outdoor recreation value added in North Carolina, 2.3% in South Carolina, 2.2% in Tennessee, 2.1% in Florida, 2.0% in Georgia, 1.9% in Virginia, 1.7% in Louisiana, 1.4% in Alabama and 1.3% in Kentucky, against Mississippi's 3.7% and Arkansas's 1.0%. The report reads the higher weights as states where the water itself, rather than the woods, is the draw.
The wildlife-watching section has two cautions. Spending of $250.2 billion includes equipment and trips, and the survey measures interest in wildlife, not the number of people who bought a guided tour. The survey counted 148.3 million watchers, 57% of the 259 million people 16 and older, and the East South Central division's 66% was the highest in the data, though divisions include states outside the Southeast.
Where It Happens
The audit sampled about 16 operators in each of 97 sub-regions, and found operators in these categories in 85 of them. North Carolina (60), Virginia (50) and Louisiana (44) have the most. As a share of each state's own audited operators, Virginia (34%) and Louisiana (30%) lean on this industry the most and Mississippi (16%) the least.
The state table sets the audit counts next to BEA numbers. Two contrasts are worth noticing. Florida has only 30 audited operators in these categories but $1,185 million of guided-tour value added, while Mississippi has 14 operators and the highest weight (3.7%). The report's reminder is that a state with many audited operators is not necessarily one with a large guided-tour economy, and the sub-regions were designed around hunting, fishing and hospitality, so some paddling businesses outside them are missing.
The report also groups the sub-regions by landscape type. Coast, bays and barrier islands hold the most audited operators in these categories (149, or 40%), then mountains and foothills (106, or 29%), rivers, deltas and wetlands (47), piedmont, plains and metro interior (37) and lakes and reservoirs (31).
A closing note applies to everyone on a river or refuge: guided trips on public land and water generally require a permit or authorization from the managing agency, and the rules differ by agency and by site. Confirm the rules for each route with the agency that manages it before selling trips.
The state table adds the weight and size columns that make the contrast visible. North Carolina has 60 audited operators (25% of its audited operators) in 10 of 10 sub-regions against $403M of 2023 value added and $17.8B of outdoor recreation in 2024. Virginia has 50 (34%) in 10 of 10, with $259M and $14.4B. Louisiana has 44 (30%) in 9 of 10, with $154M and $10.0B, and Tennessee has 42 (26%) in 8 of 10, with $283M and $15.6B. South Carolina has 31 (23%) in 6 of 6, Florida 30 (26%) in 5 of 5 with $65.3B of outdoor recreation, Georgia 29 (21%) in 6 of 6, Alabama 25 (18%) in 7 of 10, Arkansas 24 (17%) in 7 of 10, Kentucky 21 (21%) in 10 of 10 and Mississippi 14 (16%) in 7 of 10. In total the 11 states hold 370 operators (24%) in 85 of 97 sub-regions and $176.7B of outdoor recreation value added.
The Business Landscape
This chapter introduces the three kinds of business and scores them. The audit's paddle, kayak and canoe category (rentals, guided paddles, tubing and floats) is the largest category of all in the audit, at 231 operators. Whitewater rafting has 38 and eco-tours and wildlife viewing 101.
Whitewater rafting: 38 operators, mean 6.55, with 13% scoring 4 or below
Eco-tours and wildlife viewing: 101 operators, mean 6.00, with 22% scoring 4 or below
Paddle, kayak and canoe: 231 operators, mean 5.36, with 32% scoring 4 or below
That is the order the report gives, with the many small rental and guide businesses in paddle pulling its average down, and 34% of whitewater outfitters scoring 8 or above. Combined, the 370 operators score 5.66, against 5.09 for all audited operators.
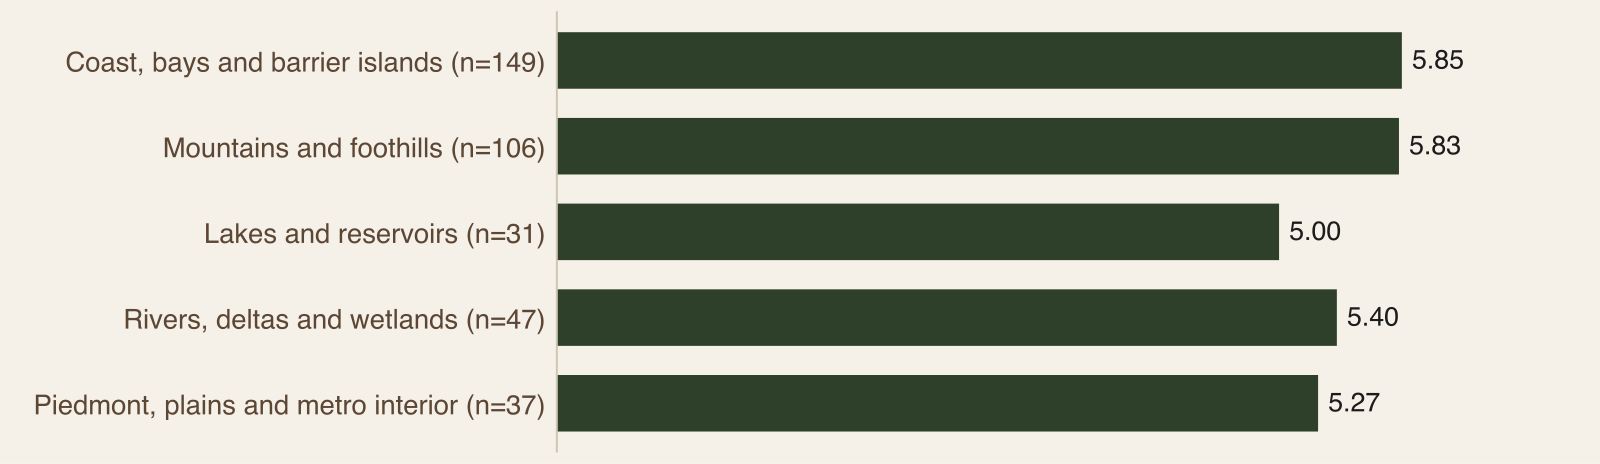
By state, ten of the eleven have enough operators to show. Florida (6.27) and North Carolina (6.23) lead, followed by South Carolina (5.71), Georgia (5.69), Tennessee (5.67), Louisiana (5.61), Virginia (5.48), Alabama (5.28) and Arkansas (5.25). Kentucky is lowest at 4.95, where 48% score 4 or below and 76% have a website. Mississippi has too few to compare. By kind of place, coast, bays and barrier islands score highest (5.85) and lakes and reservoirs lowest (5.00), with mountains and foothills close behind the coast at 5.83. The report treats these as patterns to check against your own market, and differences under half a point as noise.
The category table has columns the headline numbers skip. Paddle, kayak and canoe has 93% with their own website, 13% scoring 8 or above and 187 sites read. Whitewater rafting has 95%, 34% and 35 sites read. Eco-tours and wildlife viewing has 94%, 25% and 86 sites read. Combined, the group has 93%, 18% and 308 sites read, against 80%, 12% and 1,093 for all audited operators.
The state table shows own-website rates and sites read beside the scores. Florida's 30 operators have 97% on their own website and 26 sites read, with 10% scoring 4 or below. North Carolina has 98% and 58 sites read with 20% at 4 or below. Tennessee has 90%, 31 sites read and 29% at 4 or below, and Louisiana 93%, 34 and 30%. Virginia has 90%, 44 and 24%, Alabama 96%, 21 and 36%, Arkansas 92%, 19 and 38%, and Kentucky 76%, 14 sites read and 48% at 4 or below. Every state shown has at least 15 audited operators in these categories and at least 10 sites read.
By kind of place, coast, bays and barrier islands average 5.85 across 149 operators with 125 sites read, mountains and foothills 5.83 across 106 operators, rivers, deltas and wetlands 5.40 across 47, piedmont, plains and metro interior 5.27 across 37 and lakes and reservoirs 5.00 across 31, with only 81% on their own website and 42% scoring 4 or below.
How Buyers Search and Book
The audit sees a homepage, not a buyer, so this chapter again mixes guidance and measurement. The guidance is that buyers start with a place and an activity, then check four things: whether the trip suits the group, what it costs, whether there is room on the day, and whether the weather and water allow it.
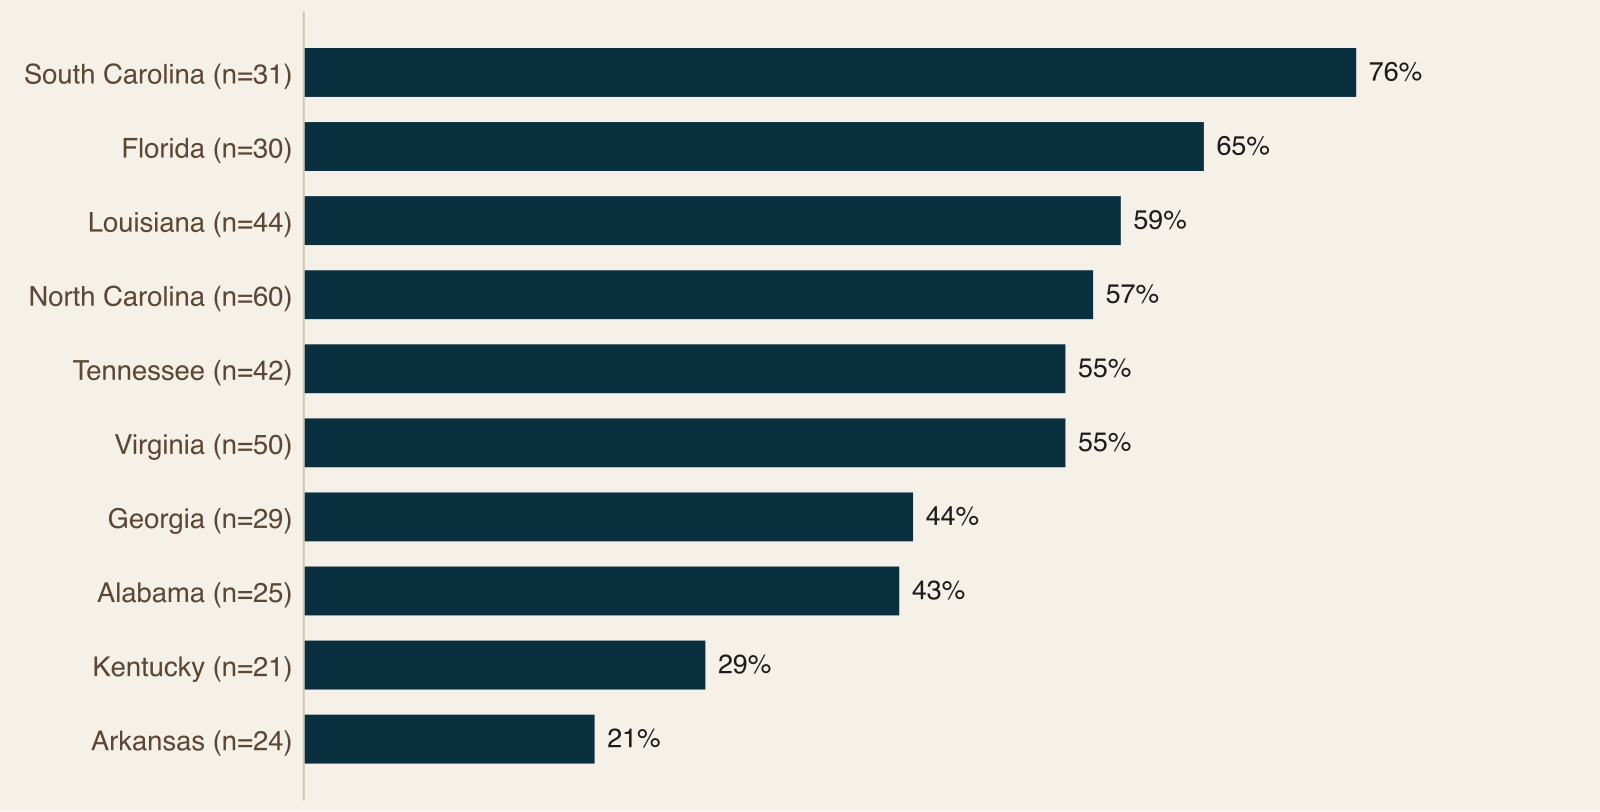
The measurement is where the industry stands out. 53% of the 308 sites read show an online booking engine, against 27% for all audited operators: eco-tours 57%, paddle 52% and whitewater 46%. Of the 163 sites with an engine, 119 (73%) use FareHarbor, and some sites use more than one platform. Adoption varies by state from 21% in Arkansas to 76% in South Carolina, and by kind of place from 33% in lakes and reservoirs to 62% on the coast.
On answers, 50% of homepages carry FAQ content against 37% overall, and whitewater outfitters lead at 77%, followed by eco-tours at 58% and paddle at 42%. The questions are practical: age and weight limits, skill level, what to wear, rain and high water, parking and shuttles. Only 3 of 308 sites mark them up as FAQ structured data, even though 69% have some structured data.
Newsletter signup is where the industry looks like everyone else, at 31% against 33%. Whitewater is highest (57%) and eco-tours lowest (23%). And 18% of sites with a detectable copyright year show 2023 or earlier, against 25% for all audited operators.
The category table sets out the full signal set. Paddle, kayak and canoe: 187 sites read, 52% booking, 42% FAQ content, 1% FAQ structured data, 29% newsletter, 64% any structured data and 19% with a copyright year of 2023 or older. Whitewater rafting: 35 sites read, 46%, 77%, 3%, 57%, 80% and 17%. Eco-tours and wildlife viewing: 86 sites read, 57%, 58%, 0%, 23%, 73% and 18%. Combined: 308 sites, 53%, 50%, 1%, 31%, 69% and 18%, against 27%, 37%, 2%, 33%, 67% and 25% for all 1,093 audited sites read.
A detail worth noting is that the booking-platform chart counts overlap, because some sites use more than one platform, and that the audit records which platforms appear on the homepage, not how well they are set up. All rates are of sites read and are lower bounds, because a feature may sit deeper in a site.
The Season and Booking Calendar
The calendar is guidance and not measured data. It runs four phases plus a year-round wildlife track: winter planning and gift purchases, early spring first-timers asking about conditions, peak-season buyers booking close to the date on a phone, and fall trips and school outings. The wildlife track exists because many eco-tour products follow nesting, migration or blooms, so the report suggests a plain "what you can see, and when" page built from your own guides' logs.
The pattern it describes is that most paddling and tour demand is warm-season, whitewater depends on rainfall and, on dammed rivers, on release schedules, and wildlife products follow animals and not months. A buyer table covers locals and day-trippers, out-of-town visitors who plan around lodging, groups and schools needing a quote, and repeat guests who rebook when reminded. As elsewhere in the series, it closes with four steps to build your own booking calendar, including writing a rain, heat and high-water policy once and showing it before checkout.
The calendar's phases each pair what buyers are doing with what an operator can publish. In winter, buyers are browsing, buying gifts and sending early group inquiries, so publish next season's dates, prices, group options and policies, refresh the homepage year and the FAQ, and test the booking flow end to end. In early spring, first-timers ask about conditions, age limits and what to bring, so post an opening announcement and a conditions page, confirm permits and insurance paperwork, and email last year's guests. In peak season buyers book close to the date, so show live availability, keep a visible weather and water policy, answer messages the same day and ask every guest for a review. In fall, promote shoulder-season dates and wildlife themes and email past guests with a rebooking offer.
The four-step exercise is to list your dates, including any release or tide dependence, mark your lead times from the last two seasons of bookings, schedule your content to lead them, and write the rain, heat and high-water policy once.
Six Moves for Operators
The six moves are: put booking on the homepage, answer buyer questions and mark them up, show conditions and policies before the guest has to ask, start a list and use it, keep the site current and safe to trust, and be clear about where you are permitted to operate. The recommended first step is to make the booking path work on a phone, so a guest can reserve in under a minute.
Each move has a number behind it. Booking: 47% of audited sites in these categories show no online booking engine, and the group's 53% compares with 27%. Answers: 50% have FAQ content, but 3 of 308 use FAQ structured data. Newsletter: 31%, no higher than the audited average. Freshness: 18% of sites with a detectable year show 2023 or earlier. The first step the report recommends is to make the booking path work on a phone, so the homepage shows what you sell, what it costs and when you have room, and a guest can reserve in under a minute.
What It Means for Operators
Read in order, the chapters give a consistent story. Demand is growing and broad, but the public data stop short of counting your market, so your own bookings remain the best read on it. The operators in these categories already lead the audit on booking and on digital health, and the advantage is uneven: whitewater and eco-tours are ahead, paddle is the stretch where the long tail of small businesses lives, and states like Kentucky and Arkansas have the most room.
The biggest gap sits in a place few competitors are looking. Half of these sites answer buyers' questions in text, but almost none publish those answers in the structured form search engines read most easily.
Read the Full Paddle, Rafting and Eco-Tours Report
The full report has the state tables, the wildlife-watching data, the category and landscape scores, the booking platform detail, the calendar and the sources and methods for every chart.
Download the full 2026-27 Paddle, Rafting and Eco-Tours report (free with your email).
Frequently Asked Questions
How big is guided water tour demand in the Southeast?
BEA's water-based guided tours and charters line was $3,206M across the 11 states in 2023, 21% of the U.S. total of $15.2 billion, with Florida the largest at $1,185M, then North Carolina ($403M) and Georgia ($375M). The line is broader than paddling alone, so it is the closest public measure of this industry and not a count of it. The state figures are for 2023, from an older BEA release, so they are not joined to the 2024 national total of $16.9 billion.
Which category of operator scores best online?
Whitewater rafting, at a mean digital health of 6.55 with 34% scoring 8 or above, then eco-tours at 6.00 and paddle, kayak and canoe at 5.36. Combined, the three categories average 5.66 against 5.09 for all audited operators. Paddle is the largest category in the whole audit at 231 operators, and the report says its many small rental and guide businesses pull the average down, with 32% scoring 4 or below against 13% for whitewater.
Which booking platform do these operators use most?
Of the 163 sites with a booking engine, 119 (73%) use FareHarbor. Some sites use more than one platform, so the counts overlap. The audit records which platforms appear on the homepage, not how well they are set up. Across the three categories the share of sites with an engine runs from 46% for whitewater to 57% for eco-tours, and by state from 21% in Arkansas to 76% in South Carolina among states with enough sites read.
Do the wildlife-watching numbers tell me how many people will book a tour?
No. The National Survey's wildlife watching includes observing, feeding and photographing wildlife near home, and its spending includes equipment. It counted 148.3 million watchers, 57% of Americans 16 and older, and the East South Central states reported the highest division rate at 66%. That measures the pool of interest eco-tour operators draw on, not the size of their market. Only Arkansas, Georgia and Kentucky published state-level results in the data collected.
Do I need a permit to run guided trips on public land or water?
Generally yes. Guided trips on national forests, wildlife refuges, state parks and other public waterways usually require a permit or authorization from the managing agency, and the rules differ by agency and by site. Commercial outfitters on national forests need a U.S. Forest Service special-use permit, and in National Park Service units they need NPS authorization. Some refuges, state parks and state wildlife areas do not allow commercial guiding at all, so confirm each route with the managing agency before selling trips.
Which states score lowest, and what does that mean for an operator there?
Kentucky is lowest at 4.95, with 76% of audited operators on their own website and 48% scoring 4 or below, followed by Arkansas (5.25) and Alabama (5.28). Florida (6.27) and North Carolina (6.23) lead. Differences under half a point are noise at these sample sizes, and Mississippi has too few operators to compare. For an operator in a lower-scoring state, the report's read is that there is more room to stand out, since the gap is mostly in booking, answers and freshness rather than in the product.
How should I read the audit counts by state?
As where the audit found operators, not as a measure of the market. The audit sampled about 16 operators in each of 97 sub-regions, and the sub-regions were designed around hunting, fishing and outdoor hospitality, so some paddling and tour businesses outside them are not in the sample. Florida has only 30 audited operators in these categories against the largest value added, and Mississippi has 14 against the biggest weight. A state with many audited operators is not necessarily one with a large guided-tour economy.
What should a paddle, rafting or eco-tour operator do first?
Make the booking path work on a phone. The homepage should show what you sell, what it costs and when you have room, and a guest should be able to reserve in under a minute. After that, write the practical answers (age, weight, skill, what to wear, weather, parking) and publish them with FAQ structured data, add a conditions page and a plain weather and high-water policy, and keep a list of past guests. Say plainly where your trips run and which permits you hold.
Sources
U.S. Bureau of Economic Analysis, Outdoor Recreation Satellite Account, March 2026 release (2019 to 2024) and November 2024 release (2023 state data)
2022 National Survey of Fishing, Hunting, and Wildlife-Associated Recreation, U.S. Fish and Wildlife Service (2022 survey conducted by NORC at the University of Chicago), national report and the Arkansas, Georgia and Kentucky state reports
Pine & Marsh Southeast audit, October 2026 (1,546 operators in 97 sub-regions, 370 in paddle, whitewater and eco-tour categories)
Related Reading
Paddle, Rafting and Eco-Tours in the Southeast: Demand and the Booking Edge
Inside the 2026-27 Outdoor Hospitality Report: State Tables, Lodging Types and Guest Calendars
Inside the 2026-27 Fly Fishing and Trout Report: A Strong Email List and a Booking Gap
Inside the 2026-27 Alabama Outdoor Report: $7.3 Billion, One Short Coast and a Permit Map for Guides


Comments