
Inside the 2026-27 Fly Fishing and Trout Report: A Strong Email List and a Booking Gap
Fly fishing and trout is a large and loyal angling base, a small and scattered set of businesses, and storefronts built more for an email than a booking. That is the one-line summary of the 2026-27 Fly Fishing and Trout report, part of the Pine & Marsh Research industry series. It sets public data from the U.S. Fish and Wildlife Service, the Bureau of Economic Analysis, the American Sportfishing Association and the Army Corps of Engineers beside our October 2026 audit of 1,546 outdoor businesses in 11 Southeastern states.
It is written for fly guides, tailwater outfitters, fly shops and trout lodges. This post walks through it chapter by chapter, in the report's own order, and says clearly where the data stop. Every figure comes from the report and the sources it cites.
At a Glance
The report opens with nine numbers. On the demand side, 39.9 million Americans 16 and older fished in 2022, 15% of that population, and the 11 states held 8.87 million paid fishing license holders in license year 2024, 30% of the U.S. total. That is -2.3% against 2020, while the national change was -1.5%. U.S. fishing value added, excluding boating, was $8.7 billion in 2024, up 58% from $5.5 billion in 2019.
On the business side, 126 audited operators fall in fly fishing and trout, 8% of the 1,546 audited, in 29 of 97 sub-regions. 84% have their own website, against 80% of all audited operators. 14% show an online booking engine, against 27%. 42% offer a newsletter signup, against 33%. And 20% have FAQ content on the homepage, against 37%.
Demand: Who Is Fishing
Fly fishing is a way of fishing, not a license class, so public data count anglers and not fly anglers. No public source counts fly or trout anglers, and the report says so wherever it uses a general series as the demand pool.
The closest measure is the paid fishing license. In 2024 the 11 states had 8,867,909 holders, 29.8% of the U.S. total of 29,807,552, on 25.7% of the national population. Counts peaked in 2021 at 9,297,700 and have fallen each year since, to 8,867,909 in 2024, which is -4.6% below the peak. The national count also peaked in 2021, at 32.2 million, against 29.8 million in 2024.
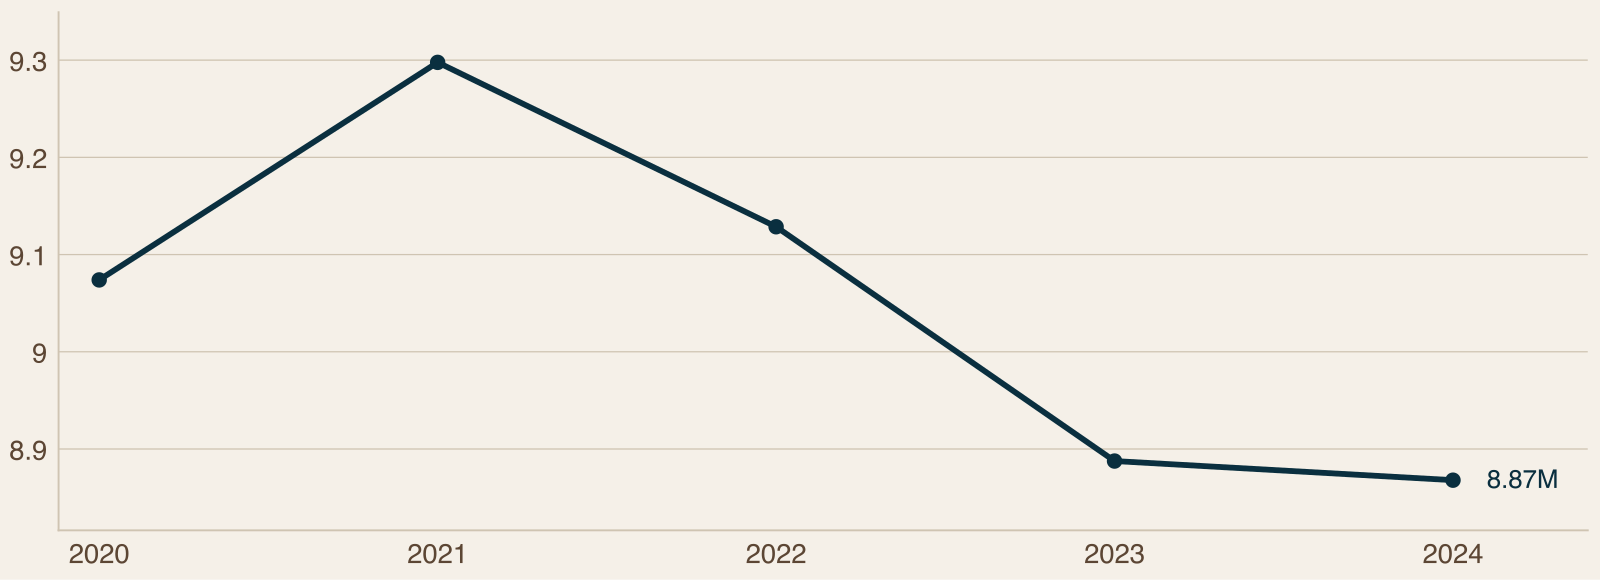
The trend is not the same everywhere. Between 2020 and 2024 Florida (+8%), Georgia (+6%) and Kentucky (+4%) grew, Tennessee was flat (+1%), and Louisiana (-14%), South Carolina (-12%) and North Carolina (-9%) fell most. Some of that reflects how states count lifetime and multi-year licenses, so the direction is more reliable than any single year.
Density is highest in Arkansas (17.2 holders per 100 residents), Louisiana (15.0) and Tennessee (12.4), against 10.1 for the 11 states. Virginia (6.5) and Florida (7.4) are lowest. Ratios are inflated where nonresidents buy licenses, which for an operator selling trips to visitors is a feature.
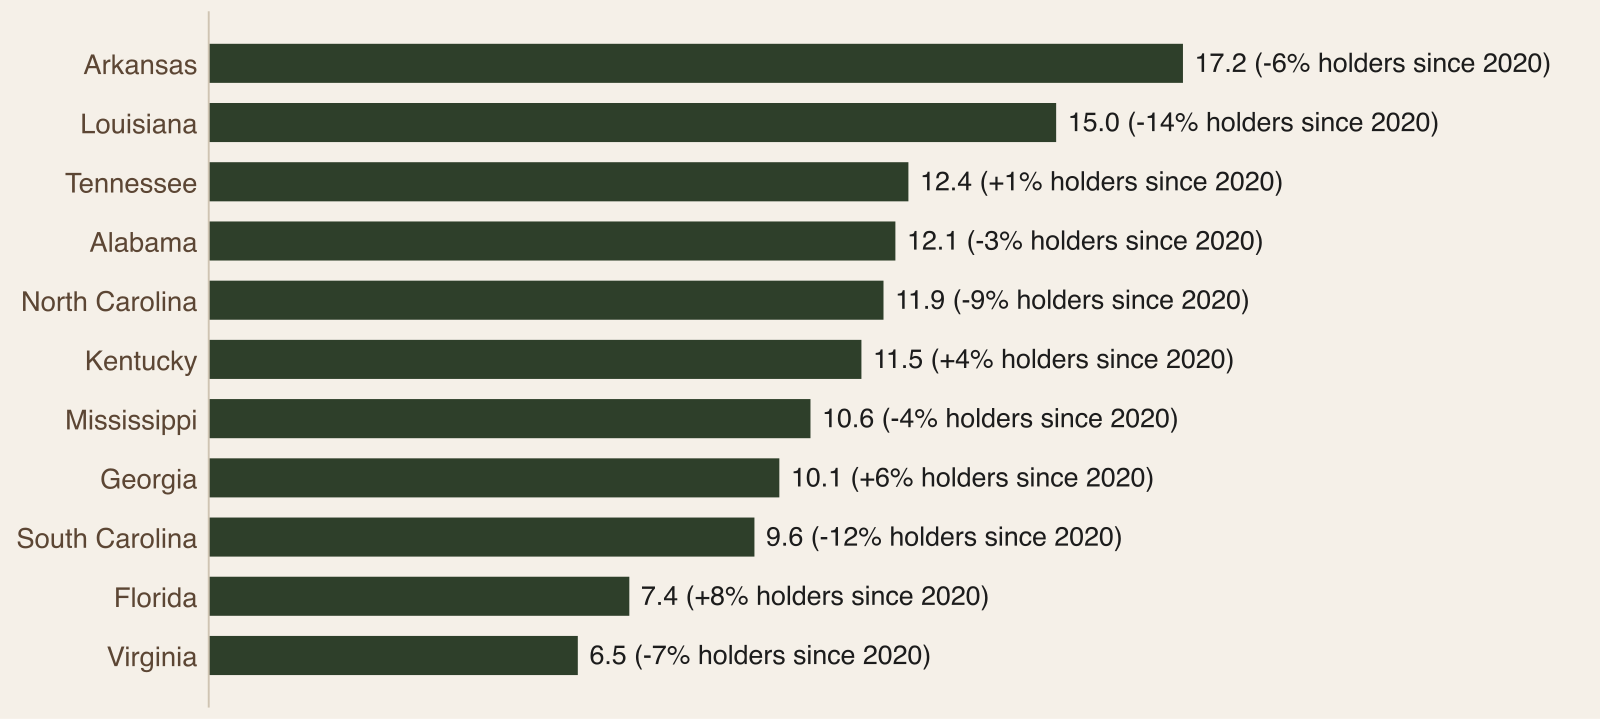
The state table puts numbers on the scale. Florida has the most paid fishing license holders (1,728,223, up 8% since 2020), then North Carolina (1,317,891, -9%), Georgia (1,129,635, +6%) and Tennessee (895,984, +1%). Louisiana has 690,992 (-14%), Alabama 626,040 (-3%), Virginia 574,708 (-7%), Arkansas 532,819 (-6%), South Carolina 529,509 (-12%), Kentucky 528,398 (+4%) and Mississippi 313,710 (-4%). Counts cover freshwater and saltwater licenses together.
The 2022 National Survey adds that anglers took 463 million trips and fished 785 million days, with 35.1 million fishing freshwater and 12.7 million saltwater. The East South Central states (Alabama, Kentucky, Mississippi, Tennessee) reported a 20% participation rate, the highest of any division, against 15% nationally. In Arkansas about 391,000 anglers were nonresidents, over two in five, which the report calls the destination effect in a single number.
The same survey put total fishing spending at $99.4B nationally, $36.6B of it on trip costs and $40.7B on equipment, and reports that 31% of anglers are women and that participation is higher among rural residents (23%) than urban ones (13%), a reminder that the trout resource and its customers are often in different places. Only Georgia, Kentucky and Arkansas published state results from the 2022 survey: in-state angling spending of $5.6B in Georgia (1.7 million anglers), $3.8B in Arkansas (907 thousand anglers) and $2.5B in Kentucky (968 thousand anglers).
BEA's fishing line rose every year from 2019 to 2024, and the broader boating and fishing line reached $38.4 billion. For 2023 the 11 states together produced $1.68B of fishing value added, 20% of the national $8.3 billion. The American Sportfishing Association puts angler spending between $917M in Mississippi and $10.7B in Florida, $37.6B across the 11 states, as industry data that is never added to the survey or BEA figures.
By state, the 2023 BEA estimates for fishing excluding boating are led by Florida ($438M), North Carolina ($226M) and Georgia ($177M), with Tennessee at $156M, Virginia at $139M and Arkansas at $69M. In the American Sportfishing Association's 2022 tables, Florida has 5.07M anglers spending $10.7B, North Carolina 1.40M and $5.1B, Georgia 1.11M and $4.4B, and Arkansas 550K and $2.1B, and the 11 states together support 295,990 jobs. ASA is an industry association, so these are shown as industry data and cover all fishing.
None of these series measures fly or trout anglers or the size of the guided-trip market. Treat them as the pool you draw from.
The Resource: Tailwaters and Trout Water
Trout live in a narrower band of water than the anglers who might pursue them. In general they are found in cold, clean streams in the Appalachian and Ozark highlands and in cold tailwaters below large dams, where water released from deep in a reservoir stays cool through the summer. Tailwaters matter commercially because they hold fish year-round and sit close to reservoirs that already draw visitors. Rules on tackle, size and harvest differ by state, river and section.
Tailwaters change by the hour with the dam. Generation and release schedules decide whether a river is wadeable, floatable or unsafe, and a guide's ability to explain the water on the day is a large part of the product and a good place to compete online.
The report is candid that no dataset gives trout stream miles, stocking numbers, tailwater angler days, trout stamp sales or guided trips, so what it says about how trout water works is general background. What it does hold is Army Corps of Engineers visitation at six dam-and-lake projects that regulate well-known trout tailwaters. Those visits are to the lakes and mostly not trout-related, but they show the visitor flow around these rivers. The six projects account for 8% of the 29.3 million Corps fishing visits nationally in FY2024.
Where It Happens
The audit sampled about 16 operators in each of 97 sub-regions, so counts show where audited operators were found, not a census. Five states each have at least 15 of the 126: Arkansas (31), North Carolina (29), Virginia (18), Georgia (17) and Tennessee (15). South Carolina has about ten, Alabama and Kentucky only a handful, and Florida, Louisiana and Mississippi none. Arkansas leans on the category most (22% of its audited operators) and Tennessee least of the five (9%).
Florida shows the limit of the audit: it has none in the sample and the largest angler spending in the region. Some fly guides on the coast may be filed under the inshore categories instead.
The state table shows how little the audit counts and the public economy line up. Sub-regions with at least one audited fly operator are 3 of 10 in Arkansas, 6 of 10 in North Carolina, 7 of 10 in Virginia, 3 of 6 in Georgia and 5 of 10 in Tennessee. The 2023 value added of fishing excluding boating in those five states ranges from $69M in Arkansas to $226M in North Carolina, and 2022 angler spending runs from $2.1B in Arkansas to $5.1B in North Carolina. A state with many audited fly businesses is not necessarily the one with the largest fishing economy. And because the audit's sub-regions were designed around hunting, fishing and outdoor hospitality, a trout stream outside one of them is not in the sample.
The category is concentrated. One sub-region, White River Tailwater / Bull Shoals / Norfork in Arkansas, holds 18 of the 126. By kind of place, mountain and foothill sub-regions hold 67 (53%) and lake and reservoir sub-regions 40 (32%), which is where the Arkansas tailwater sub-regions fall.
On public land and water, the report is plain. Many trout streams and tailwaters run through national forests, national parks, wildlife management areas, Corps property and state-managed waters. Guiding there generally requires a permit or authorization from the managing agency, and some waters limit commercial use or the number of guides. Confirm the rules for each water with the managing agency, and say clearly on your site where you are authorized to guide.
The Business Landscape
Fly Fishing and Trout is the audit's category for fly guides, fly shops, tailwater and trout outfitters and the like. It is the fourth largest of the audit's 20 operator categories, and it includes fly guides on lake waters, trout cabin resorts and lodges that sell guided trips, so 126 is an upper bound on trout guides.
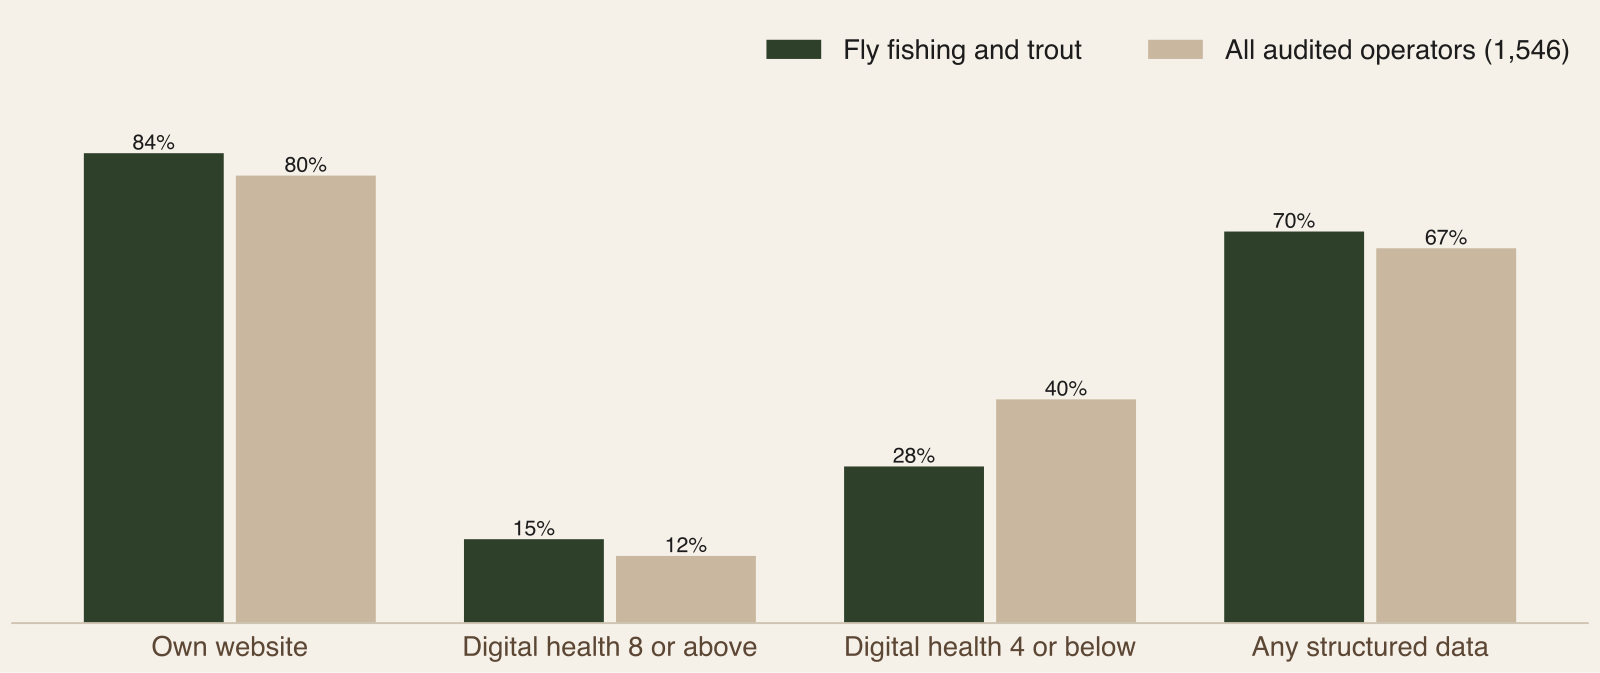
Against the 1,546-operator benchmark, these operators are ahead on the headline measures. Mean digital health, a 1 to 10 score our researchers assign from observed evidence, is 5.53 against 5.09. 28% score 4 or below against 40%, and 15% score 8 or above against 12%. The front door is about average: 84% have their own website against 80%, so about one in six still runs on a social page, a directory listing or someone else's site. 99% of sites are secure and 88% mobile-ready, against 97% and 92%.
By state, five have enough operators to show. Georgia has the highest mean digital health (6.06), then Virginia (6.00), North Carolina (5.90), Tennessee (5.47) and Arkansas the lowest (5.06). Fly-fishing operators are ahead of their state's audited average in North Carolina, Virginia and Georgia and behind in none. Differences smaller than about half a point of score are noise at these sample sizes.
The state detail adds the front door and the tail. Own-website rates are 94% in Georgia, 89% in Virginia, 83% in North Carolina, 93% in Tennessee and 74% in Arkansas, and the share scoring 4 or below runs from 18% in Georgia to 42% in Arkansas. The all-operator averages in the same states are 5.37 in Georgia, 5.08 in Virginia, 5.43 in North Carolina, 5.31 in Tennessee and 4.91 in Arkansas, so the fly operators' lead is largest in Virginia and Georgia and smallest in Arkansas and Tennessee.
By kind of place, mountain and foothill operators average 5.75 and lake and reservoir operators 5.10, against 5.09 for the audited average.
Mountain and foothill operators have 93% with their own website and 21% scoring 4 or below, from 60 sites read, while lake and reservoir operators have 75% and 38%, from 27 sites read. The other three types, coast, river and wetland, and piedmont and metro, have too few operators to describe in numbers, and the grouping is a Pine & Marsh judgment, not an official classification.
How Buyers Search and Book
The audit sees a homepage, not a search. As general guidance, a buyer usually starts with a water and an intention, such as a river, a lake or a town plus "guided fly fishing" or "trout guide", and looks for four things: whether the trip suits their skill level, what the day includes, whether the guide has room on their dates, and what the river is doing.
The report's homepage signals, from the 100 fly-fishing sites read:
14% show an online booking engine, against 27% of all audited operators. Put the other way, 86% show no way to book without a phone call, a message or a form.
42% offer a newsletter signup, against 33%. This is the industry's clear strength.
20% carry FAQ content, against 37%, and only a handful mark answers up as FAQ structured data.
23% of sites with a detectable copyright year show 2023 or earlier, against 25%.
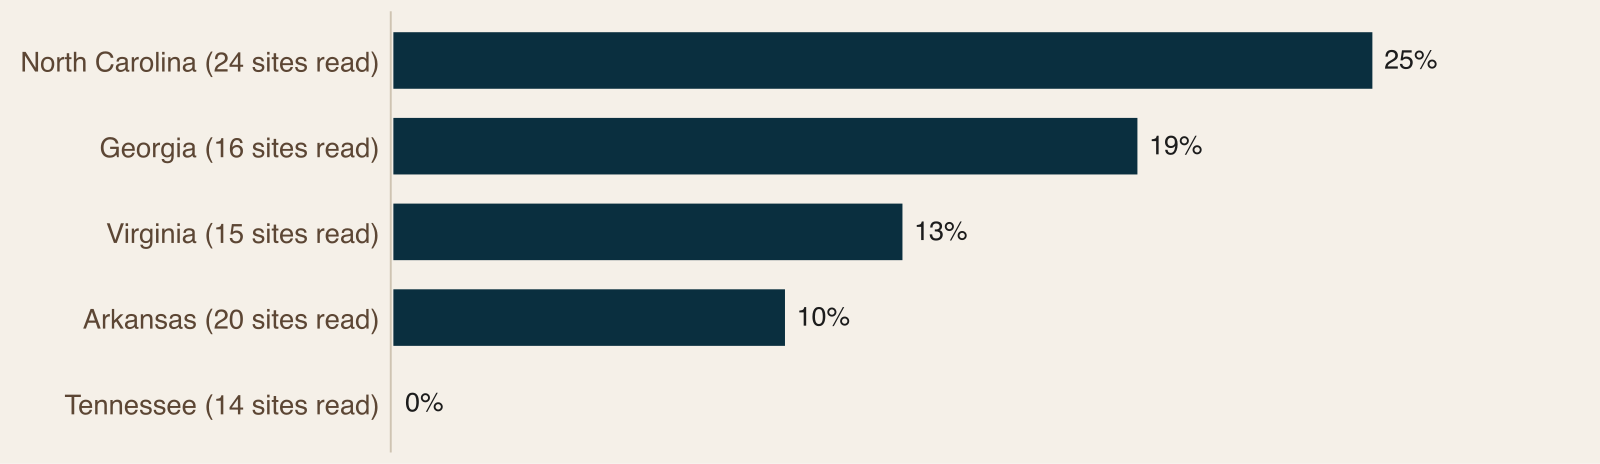
Booking-engine use runs from 0% in Tennessee to 25% in North Carolina among states with enough sites, though differences under about 10 points are noise. A lower booking rate is understandable for a personal, scheduled service, but a buyer who finds the page at night has no way to hold a date. The email list fits the business: anglers return to the same water and the same guide and book months ahead.
Where an engine is present, two platforms account for nearly all of the sites and one other appears once, but the sample is too small to describe market share. By kind of place, mountain and foothill sites show 13% booking-engine use and lake and reservoir sites 15%. Practical questions are what stop a booking, and the report lists them: skill level and age limits, what to bring and what is provided, wading or boat, what happens with high water or a release, and where to meet. 70% of the sites have some structured data, much of it added automatically by website builders.
The Season and Booking Calendar
The calendar is general guidance, not measured data. Fly-fishing demand is less tied to one season than paddling or hunting, so the calendar that matters most is the river's and the guide's own. The report runs four phases: winter for planning and gifts, spring as water warms and buyers ask about conditions, summer when cold tailwaters stay fishable, and fall for a second wave of trips and lodging. It also separates how local day-trippers, out-of-town visitors, beginners and experienced anglers book.
The Season and Booking Calendar
The calendar is general guidance, not measured data. Fly-fishing demand is less tied to one season than paddling or hunting, so the calendar that matters most is the river's and the guide's own: when water conditions turn, when regulations change, when inquiries rise and when they drop away. The report runs four phases.
Winter: anglers plan and buy gifts, and some tailwater and spring-fed waters fish year-round. Publish next season's dates, trip types and policies, refresh the homepage year and the FAQ, and send the first email of the year to past guests.
Spring: interest rises as water warms, and run-off and rain can make streams unfishable, so buyers ask about conditions. Keep a short conditions page current, post availability early and confirm permits and insurance paperwork.
Summer: cold tailwaters stay fishable and draw visitors, while freestone streams can run low and warm. Explain release and generation schedules in plain language, show same-week availability and ask every guest for a review.
Fall: cooler weather and scenery bring a second wave of trips and lodging bookings, and some waters carry special rules. Check and publish any seasonal regulations on your water, promote shoulder-season dates and email past guests with a rebooking note.
The report also separates how buyers book. Locals and day-trippers decide close to the date and need same-week availability and a visible cancellation rule. Visitors plan around lodging and travel dates, usually well ahead of locals. Beginners and families want lessons and reassurance about skill and safety, so give them a page on what is included and what to bring. Experienced anglers ask about water, flows and recent reports and often rebook the same guide. To build your own calendar, list your dates, pull the last two seasons of bookings to see how far ahead each type of guest booked, schedule content to lead them, and write your high-water, low-water and release-schedule policy once.
Six Moves for Operators
The report closes with six moves. For the full marketing playbook, see Marketing a Fly Fishing Guide Service in the Southeast.
Make a trip bookable on the homepage. 86% of fly-fishing sites read show no online booking engine, against 73% of all audited operators. A visible "Book" or "Check dates" button that lets a guest hold a day on a phone is the clearest gap to close.
Publish the water, not just the trip. A current conditions and flows page, with release schedules explained in plain language, answers the first question a tailwater buyer asks and gives search engines a reason to return to the site.
Answer the questions buyers ask, and mark them up. 20% of homepages have FAQ content and only a handful of the 100 sites read use FAQ structured data. Write the practical answers and publish them in structured form.
Use the email list you already have. 42% of these sites offer a newsletter signup, ahead of the 33% audited average. Send a season-opening note, post new dates there first and remind past guests when the water turns.
Be clear about where you are permitted to guide. Where trips run on national forest, park, Corps, wildlife-area or state water, say so, and keep your permit and agency-rules content accurate.
Close the front-door gap and keep the site current. 16% of audited fly-fishing operators have no website of their own against 20% overall, and 23% of sites with a detectable copyright year show 2023 or earlier. Own the address, update dates and photos each season, and show guide qualifications, safety and insurance in plain view.
What the Report Cannot Tell You
No fly or trout series exists. None of the datasets counts fly anglers, trout anglers, trout stamps, tailwater angler days, stocking or guided trips, so every demand figure covers all fishing.
License holders include lifetime holders and visitors, some states count lifetime, multi-year and combination licenses in ways that make holders exceed licenses sold, and holders per 100 residents include nonresident buyers.
The six Corps projects are a Pine & Marsh selection of dam-and-lake projects, visits are for the whole project, and Tennessee Valley Authority tailwaters are not in the Corps data.
The audit is a structured sample of about 16 operators per sub-region, not a census, and the report does not measure AI-answer or map-result visibility, which is still being tested.
What It Means for Operators
The angling pool is large but past its 2021 peak, so the case for growth rests on winning a bigger share of visitors and returning guests, not on a rising tide. Because no public source counts fly anglers, use your own bookings and inquiries to judge your market.
The storefront shows where to put effort. These operators are ahead of the audited average on digital health and on email, and well behind on booking and answers. A way to hold a date, a conditions page and a short FAQ are the gaps to close, and the list you already have is the asset to use.
Water and permits come first. Tailwater schedules change the product by the hour, and guiding on public water generally needs authorization from the managing agency. Say where you are permitted, and confirm the rules for each water.
Get the Report
The full report adds the state tables, the sub-region analysis, the angler spending tables and a methodology chapter with data gaps and sources.
Download the full 2026-27 Fly Fishing and Trout report (free with your email).
Frequently Asked Questions
How many people fly fish or fish for trout in the Southeast?
No public source counts them. The report uses all-fishing data as the pool: 8,867,909 paid fishing license holders in the 11 states in 2024, 30% of the U.S. total, and 4.6% below the 2021 peak. The 2022 National Survey counted 39.9 million anglers nationally, with 35.1 million fishing freshwater. Fly-specific participation and trout stamp counts are a data gap, so use your own bookings and inquiries to size your market.
Are fishing license sales rising or falling?
Falling since 2021. The 11 states had 9,297,700 holders in 2021 and 8,867,909 in 2024, and the change since 2020 is -2.3%, against -1.5% nationally. Florida (+8%), Georgia (+6%) and Kentucky (+4%) grew, while Louisiana (-14%), South Carolina (-12%) and North Carolina (-9%) fell most. Some of that reflects how states count lifetime and multi-year licenses, so the report says the direction is more reliable than any single year.
Where are fly-fishing businesses concentrated?
In five states: Arkansas (31 audited operators), North Carolina (29), Virginia (18), Georgia (17) and Tennessee (15). The White River Tailwater, Bull Shoals and Norfork sub-region in Arkansas alone holds 18 of the 126. By kind of place, mountain and foothill sub-regions hold 53% and lake and reservoir sub-regions 32%. The audit is a structured sample, not a census, and some coastal fly guides are filed under the inshore categories instead.
How do fly-fishing websites compare with other outfitters?
They are ahead on digital health (5.53 against 5.09), on the share scoring 4 or below (28% against 40%) and on newsletter signup (42% against 33%). They are behind on online booking (14% against 27%) and FAQ content (20% against 37%). Of the 100 sites read, 99% are secure and 88% mobile-ready. The signals come from homepages read on October 17, 2026, so they are lower bounds.
Which states have the strongest fly-fishing websites?
Among the five states with enough operators to show, Georgia leads at 6.06, then Virginia (6.00), North Carolina (5.90) and Tennessee (5.47), with Arkansas lowest at 5.06. Fly operators are ahead of their state's audited average in North Carolina, Virginia and Georgia and behind in none. Differences smaller than about half a point of score are noise at these sample sizes, so treat the ranking as a pattern to check against your own market.
What stops a guest from booking a fly trip online?
Mostly unanswered practical questions and no way to hold a date. The report lists skill level and age limits, what to bring and what is provided, wading or boat, what happens with high water or a release, and where to meet. Only 14% of fly sites show an online booking engine, so 86% require a call, message or form. A buyer who finds the page at night has nothing to act on, and the report suggests a visible check-dates button.
Why does the water matter for marketing a tailwater?
Tailwaters change by the hour with the dam. Generation and release schedules decide whether a river is wadeable, floatable or unsafe, and a guide's ability to explain the water on the day is a large part of the product. The report suggests a conditions and flows page, with schedules in plain language, updated on the days that matter. It answers the first question a tailwater buyer asks, and gives search engines a reason to return.
Can I guide on public water?
Only with the right authorization. Guiding on national forest, park, Corps, wildlife-area or state water generally requires a permit from the managing agency, and rules differ by agency, state and stretch of river. On national forest water that is a U.S. Forest Service special-use permit, and in a national park an NPS commercial use authorization or concession contract. Some waters limit commercial use or the number of guides, so confirm for each water and say on your site where you are authorized.
What is the first thing a fly guide should do after reading the report?
Publish a plain conditions page and put a way to hold a date next to it. The report's closing advice is that those two answer what a buyer most wants to know: is the water fishable, and can I have a day. After that, use the email list, since 42% of fly sites already have a signup, and add the practical FAQ answers. The audit shows fly operators lead on email and trail on booking and answers.
Sources
U.S. Fish and Wildlife Service, Wildlife and Sport Fish Restoration Program: certified fishing license data, license years 2020 to 2024
2022 National Survey of Fishing, Hunting, and Wildlife-Associated Recreation, including state reports for Arkansas, Georgia and Kentucky
U.S. Bureau of Economic Analysis, Outdoor Recreation Satellite Account, November 2024 release (2023 data) and March 2026 release (2024 data)
American Sportfishing Association, national and state economic contribution of sportfishing, 2022 data
U.S. Army Corps of Engineers, visitation by project, fiscal year 2024
U.S. Census Bureau, population estimates, vintage 2025
Pine & Marsh Southeast audit, October 2026 (1,546 operators in 97 sub-regions)


Comments