
Outdoor Hospitality in the Southeast: Cabins, Campgrounds and RV Parks by the Numbers
Cabins, glamping units, campgrounds, RV parks and sporting lodges are not licensed, counted or reported as one industry. There is no single public number for outdoor hospitality, which makes it easy to guess at demand and hard to know where to put effort. Our 2026-27 Outdoor Hospitality report pulls together the public data that does exist and pairs it with our October 2026 audit of lodging and campground businesses in 11 Southeastern states.
This post covers what the report found, what it means for owners, and what to fix first. Every number comes from the report and its public sources.
What the Outdoor Hospitality Report Found
Camping is growing, and RVing is off its peak. The Bureau of Economic Analysis (BEA) measures value added, the contribution to GDP, for outdoor recreation. Its climbing, hiking and tent camping line rose from $3.8 billion in 2019 to $7.75 billion in 2024, up 102%. Its RVing line rose from $22.5 billion in 2019 to a peak of $31.2 billion in 2022, then fell to $27.8 billion in 2023 and $27.5 billion in 2024. That leaves RVing 22% above 2019 and 12% below the peak.
These lines measure activity, not the revenue of campgrounds, RV parks or lodges. The tent camping line also covers climbing and hiking, and neither line has a glamping or cabin component. They are the closest public measures of the demand a camping business draws on, not a count of the market.
The 11 states hold about 19% of national RVing value added: $5.14 billion in 2024. Florida is the largest at $1,627 million, followed by North Carolina ($537 million) and South Carolina ($482 million).
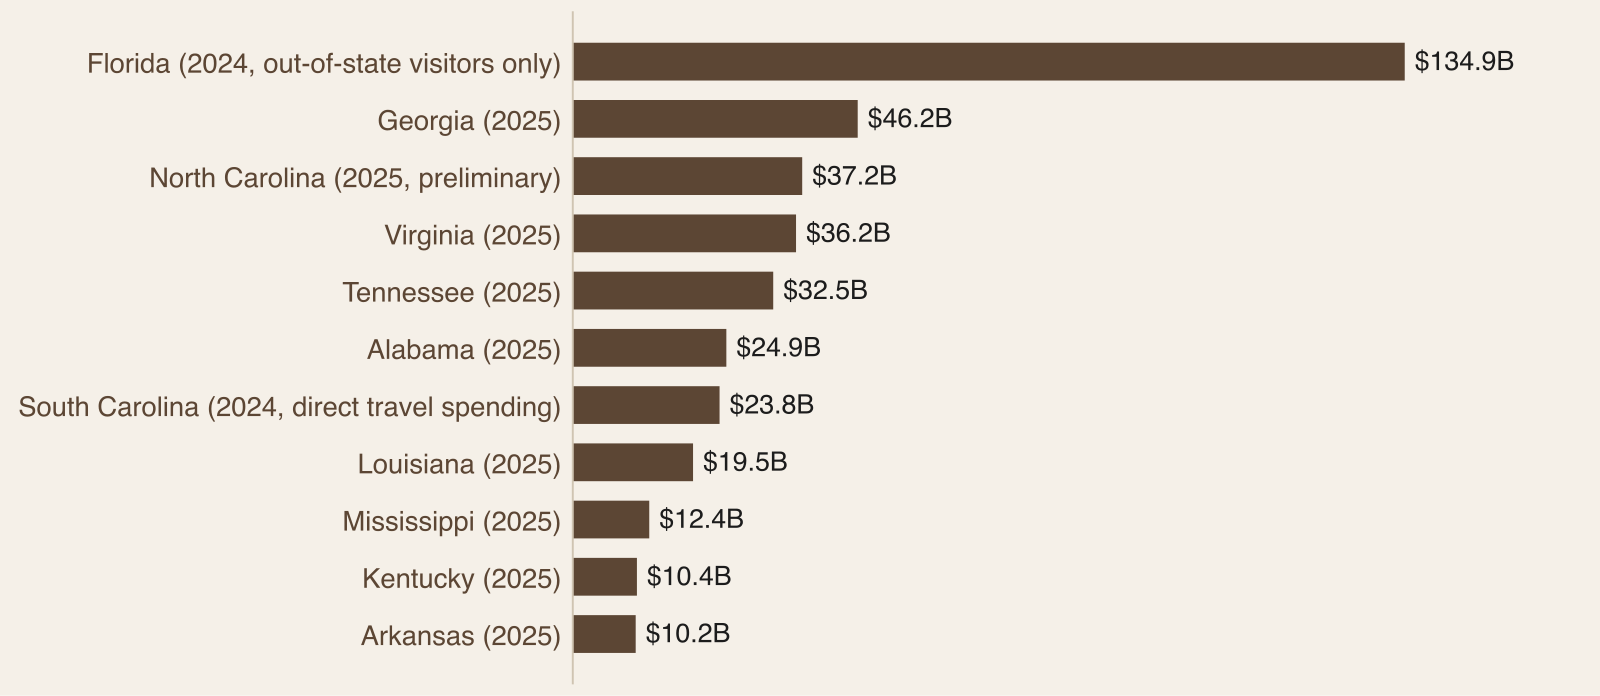
State tourism reports describe a larger economy. They put visitor spending at $134.9 billion in Florida (2024, out-of-state visitors only), $46.2 billion in Georgia and $37.2 billion in North Carolina (preliminary). Definitions differ by state, so these are a map of scale, not a league table.
Two Measures That Must Not Be Added
BEA value added and state visitor spending overlap, and it helps to keep the two apart. BEA's "supporting" category, which includes trip lodging, food and transport, is 48% of U.S. outdoor recreation value added, $331 billion of $697 billion in 2024. State tourism reports count much of the same spending. A cabin stay can appear in both. The report shows each source on its own and never combines them, and neither BEA's supporting line nor its accommodation and food services line isolates lodging.
So treat the public figures as the size of the pool your guests come from. Your own booking records are the only measure of your demand.
RVing and Camping Over Five Years
The national lines tell two different stories. BEA's RVing value added went from $22.5 billion in 2019 to $31.2 billion in 2022, then to $27.8 billion in 2023 and $27.5 billion in 2024. Climbing, hiking and tent camping kept climbing, from $3.8 billion to $7.75 billion, more than doubling (+102%). Because the camping line is smaller, the dollar gain is modest next to RVing's swings, but the direction is not in doubt.
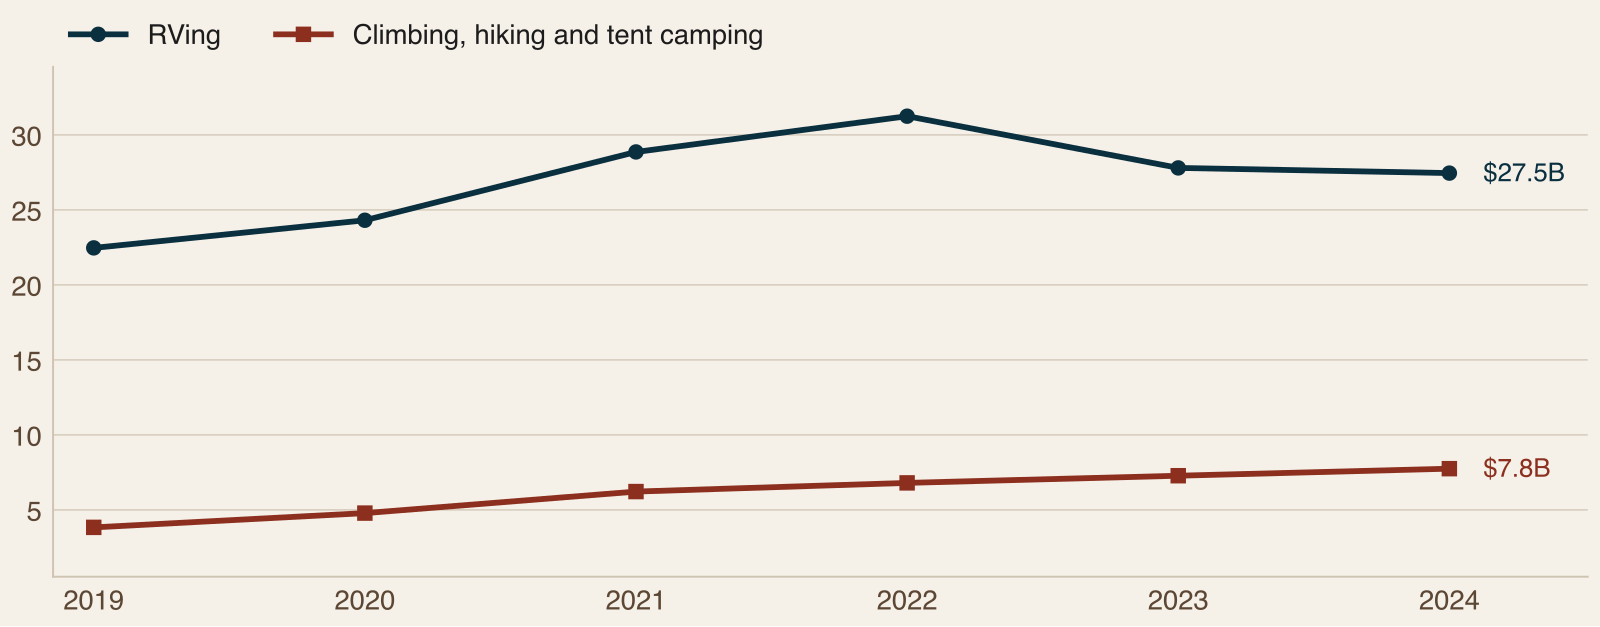
For an owner, the practical reading depends on your product. A cabin or tent site near trails and water is selling into the line that has grown. An RV park is selling into a line that is 22% above 2019 but 12% below its peak. Neither line is revenue for your business, and glamping has no line at all, so use these as context and your own booking records as the test.
State by State: RVing, Camping and Visitor Spending
In 2024 the 11 states produced $5.14 billion of RVing value added, 19% of the U.S. total of $27.5 billion. Florida leads at $1,627 million, then North Carolina ($537 million) and South Carolina ($482 million). RVing is a larger share of outdoor recreation in Alabama (5.4%) than in Louisiana (2.2%). For tent camping, hiking and climbing, BEA's state detail is for 2023 and comes from an older release, so it is not used to compute change. The 11 states produced $1,617 million, led by Florida at $375 million, with North Carolina and Georgia at $216 million each, Virginia at $172 million and South Carolina at $165 million.
Visitor spending is the broader frame. Ten of the 11 states publish a total, from $10.2 billion in Arkansas (54.3 million visitors) to $134.9 billion in Florida (143.0 million visitors, out-of-state only). Georgia reports $46.2 billion from 175.6 million visitors, Virginia $36.2 billion from 117.1 million, Alabama $24.9 billion from 29.2 million, Louisiana $19.5 billion from 45.0 million, Mississippi $12.4 billion from 45.5 million and Kentucky $10.4 billion from 81.1 million. Tennessee reports 150.0 million visits and $32.5 billion, and North Carolina's $37.2 billion is preliminary. South Carolina's $23.8 billion is direct travel spending. Definitions differ by state, so the chart is a map of scale, not a league table.
BEA's supporting category, which covers trip lodging, food and transport, is 48% of U.S. outdoor recreation value added, and it runs from 44% in Alabama to 59% in Louisiana. That is the closest the public data come to the guest-stay economy, but its accommodation and food services line, at $97.7 billion nationally, includes restaurants and other spending, so neither isolates lodging.
How 84 Audited Lodging Operators Look Online
The audit verified 1,546 private operators across 97 sub-regions. Of those, 84 (5%) are lodging or campground businesses, found in 45 sub-regions. They are mostly lodges, resorts and cabins. Campgrounds and RV parks are a minority, and public parks, cabins and campgrounds are excluded, so the report is strongest on lodges, resorts and cabins. The sample was built around sporting and outfitter markets, which means coastal resorts, city hotels and large campground chains outside those markets are largely absent. No state has enough audited lodging operators for a state comparison. The most in any state is 12, in Arkansas, and none turned up in South Carolina.
Compared with the 1,546-operator benchmark:
Mean digital health, our 1 to 10 score from observed evidence, is 5.38 against 5.09.
31.0% score 4 or below, against 39.8%.
91.7% have their own website, against 80.2%.
44.3% of homepages carry FAQ content, against 36.9%.
40.0% offer a newsletter signup, against 32.7%.
25.6% of sites with a detectable copyright year show 2023 or earlier, against 25.0%.
Lodging operators are somewhat stronger than the benchmark, and they lean on repeat guests, which the newsletter number fits.
Where the Audit Found Lodging
The audit sampled about 16 operators in each of 97 sub-regions, so the counts show where audited lodging was found, not a census. Arkansas has the most (12), then Tennessee (11), with Alabama, Kentucky and Mississippi at 10 each, Louisiana at 9, Georgia and North Carolina at 7 each, and Florida and Virginia at 4 each. None turned up in South Carolina. Measured against each state's own audited operators, Mississippi (11%) and Kentucky (10%) lean the most on lodging. A state with many audited lodging operators is not necessarily one with a large lodging economy, and coastal resorts, city hotels and large campground chains outside the sporting and outfitter sub-regions are largely absent.
The group is mostly lodges and cabins. The recorded business types, which are free text and overlap, include lodge (41), cabin (33), resort (20), RV (10) and campground or camping (9). Of the 84, 29 are in the audit's top tier, 30 in the middle tier and 25 in the lower tier. The audit counts private, for-profit businesses only, so publicly run cabins, campgrounds and park lodges are not in it.
Scores by Kind of Place
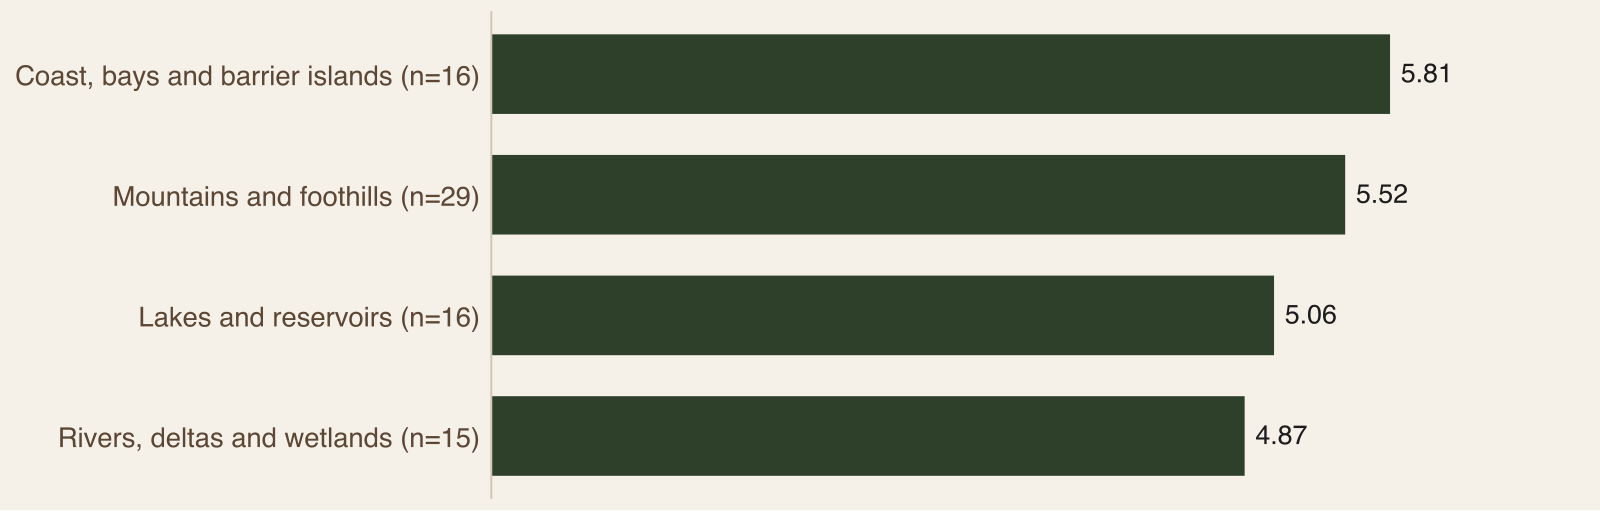
The report groups the 97 sub-regions into five types by their defining landscape. Mountains and foothills hold the most audited lodging operators (29, or 35%), followed by coast, bays and barrier islands (16), lakes and reservoirs (16), rivers, deltas and wetlands (15) and piedmont, plains and metro interior (8). Coast sub-regions score highest at 5.81 with 94% on their own website and 25% scoring 4 or below. Mountains and foothills average 5.52, lakes and reservoirs 5.06 (81% on their own website) and rivers, deltas and wetlands 4.87. Piedmont, plains and metro interior has too few operators to score. The groupings are broad and judgment-based, so treat the pattern as something to check against your own market.
The signals vary by place. FAQ content is highest on lakes and reservoirs (61.5%), then coast (46.2%), rivers (41.7%) and mountains (37.5%). Newsletter signup is highest in the mountains and foothills (54.2%), against 41.7% on rivers, 30.8% on the coast and 23.1% on lakes. Booking-engine cells run from 0 to 3 sites and are too small to rank.
Booking: A Floor, Not a Ceiling
Only 7 of the 70 lodging sites we could read (10.0%) show a booking engine our scanner detects, against 27.0% of all audited operators. Six of the seven use FareHarbor and one uses Peek.
Read that number carefully. Our scanner matches a short list of tour, activity and appointment tools. It does not look for lodging property-management systems or campground reservation platforms, so it may miss the systems lodging businesses actually use. The rate is a floor, and it understates online booking by an amount these data do not show. What can be said is that 90% of the sites show no detectable booking path on the homepage.
Answers show a similar gap. Although 44.3% carry FAQ content, only 3 of 70 sites mark it up with FAQ structured data, the format search engines read most easily, even though 75.7% have some structured data on the homepage.
The scanner's blind spot is worth understanding. It matches a short list of 12 tour, activity and appointment tools: FareHarbor, Wix Bookings, Peek, Xola, Checkfront, Bookeo, Rezdy, FishingBooker, Calendly, Square Appointments, Acuity Scheduling and Tripworks. Across the whole audit the most common detected engines are FareHarbor (191), Wix Bookings (51) and Peek (38). No dedicated lodging property-management or campground reservation system is on that list, so a cabin site that takes reservations through one is not detected. The report names re-scanning with lodging-specific signatures as the obvious next step.
In the lodging group, 7 of 70 sites show a detected engine (10.0%), against 295 sites and 27.0% for the benchmark, about two fifths of the benchmark rate. FAQ structured data is on 4.3% of lodging sites (3 of 70) against 2.0%, while any structured data is on 75.7% against 66.9%.
What This Means for Owners
If you run a cabin rental, a campground or an RV park, three things follow from the data.
First, the demand shape is not uniform. BEA's climbing, hiking and tent camping line has doubled since 2019 while RVing has pulled back from a 2022 high. If your product leans one way, plan your content and your calendar around it, and check your own numbers before you change anything.
Second, the guest compares you with a listing site. Many guests look at photos and reviews on third-party listings first, and your own site competes with those listings for the booking. The practical test is simple: from the homepage, can a guest see open dates and reserve in under a minute? If not, they go back to the listing. Our post on direct booking versus Airbnb and VRBO commission math shows what that detour costs a cabin owner.
Third, the answers guests want are repetitive. Pets, check-in and check-out, minimum stays, cancellation, hookups, firewood, boat parking and cell service come up again and again. You are likely answering them by phone today.
How Guests Book, and When
The audit does not measure how guests search, so this is general guidance. A guest planning a cabin weekend, a campsite, an RV stop or a lodge stay tends to start with a place and a kind of stay, then compares a handful of options on four things: whether it fits their group, what a stay includes, whether their dates are open, and what the cancellation and house rules are.
Weekend and family guests plan around a school or work calendar, usually weeks ahead, so show clear dates, photos of every unit and a plain cancellation rule.
Campers and RV travelers check site size, hookups, pets and rules first, so give them a site-by-site page with live availability.
Sporting and fishing parties book seasons in advance, often a year ahead for prime weeks, so give them season pages, group capacity and a quick inquiry form.
Groups and reunions inquire early and want one invoice, so give them a group page with capacity and minimums.
Repeat guests rebook when reminded, so keep a newsletter list and a simple rebooking message.
The year runs in five phases. Winter is planning, so publish next season's open dates and test the booking path end to end. Spring brings shoulder-season getaways, so post an opening notice and confirm permits, insurance and inspections. Summer is peak, booked weeks or months ahead for weekends and last-minute for midweek, so show live availability and answer messages the same day. Fall brings foliage trips, hunting parties and group retreats, and sporting lodges and cabins near public land run their busiest weeks. The off-season suits remote workers, small groups and local guests, so promote midweek stays to your list.
Why Marinas Were Left Out
The audit's marina and houseboat rental category has 132 operators, but its main product is not a stay, so it is disclosed and left out. It averages 4.78 with 28.0% carrying FAQ content, against 5.38 and 44.3% for lodging. Combining the two would give 216 operators and a mean of 5.01, and would move FAQ content from above the benchmark to below it, which would blur what the report is about.
Practical Moves
Put a booking path on the homepage. Whatever system you use, show open dates and let a guest reserve or send an inquiry on a phone in under a minute. If you already have a reservation system, make the button obvious.
Write the practical answers once and publish them as an FAQ with structured data.
Build a page for each unit or site type with photos, capacity, what is included and house rules. For campers and RV travelers, include size, hookups and rules.
Start a list and use it. Remind past guests when dates open and when midweek or off-season stays are available.
Update dates, photos and policies each season, and show licensing, inspection and insurance details in plain view.
Be clear about what is yours and what is public. Many lodges, cabins and campgrounds sit beside national forests, wildlife refuges, wildlife management areas and state parks. If you offer guided trips, say where they happen and confirm the rules for each place with the managing agency, since guiding on public land and water generally requires a permit or authorization from that agency.
Read the Full Outdoor Hospitality Report
The full report has the state RVing table, visitor spending by state, results by kind of place (coast, mountains, lakes and rivers), a year of booking behavior and six moves for operators.
Download the full 2026-27 Outdoor Hospitality report (free with your email).
Sources
U.S. Bureau of Economic Analysis, Outdoor Recreation Economic Statistics, March 5, 2026 release (2024 data), and the Outdoor Recreation Satellite Account, November 2024 release (2023 state data)
State tourism economic-impact reports for Alabama, Arkansas, Georgia, Kentucky, Louisiana, Mississippi, North Carolina, Tennessee and Virginia (2025 data) and Florida and South Carolina (2024 data)
Pine & Marsh outfitter audit, rebuilt and verified October 2026: 1,546 operators across 97 sub-regions, with website signals read October 17, 2026
Frequently Asked Questions
Is camping really growing in the Southeast?
Nationally, yes. BEA's climbing, hiking and tent camping line rose from $3.8 billion in 2019 to $7.75 billion in 2024, up 102%. That is a national activity measure that also includes climbing and hiking, not the revenue of any campground. The report has no growth figure for the 11 states, because its state detail for that line is for 2023 only, from an older BEA release, so it cannot show a Southeast trend on its own. In 2023 the 11 states produced $1,617 million on that line.
Is the RV market shrinking?
It is off its peak, not collapsing. BEA's RVing value added peaked at $31.2 billion in 2022 and was $27.5 billion in 2024, 12% below the peak but 22% above 2019. In the 11 states it was $5.14 billion in 2024, about 19% of the national total, led by Florida ($1,627 million), North Carolina ($537 million) and South Carolina ($482 million). RVing is also a larger share of outdoor recreation in Alabama (5.4%) than in Louisiana (2.2%).
Can I add BEA value added to state visitor spending to size the market?
No. The two measures overlap, because tourism reports count much of the same trip lodging, food and transport spending that BEA places in its supporting category, which is 48% of U.S. outdoor recreation value added. A cabin stay can appear in both. The report shows each on its own, never totals them, and does not total visitor spending across states because definitions differ. Treat the figures as the size of the pool your guests come from, and use your own booking records for your own demand.
Does only 10% of lodging sites taking online bookings mean 90% cannot take reservations?
No. The scanner detects 12 tour, activity and appointment booking tools and does not look for lodging property-management or campground reservation systems. The 10.0% figure, 7 of 70 sites, is a floor and understates online booking by an amount these data do not show. What it does show is that 90% of the sites read show no booking path our scanner can detect on the homepage, so a guest comparing stays on a phone may still be sent back to a listing site.
Why are there no state results for lodging operators?
The audit was built around sporting and outfitter markets, and no state reached the 15 lodging operators the report requires for a state comparison. The most in any state is 12, in Arkansas, and none were found in South Carolina. Results are shown for the 11-state group and by kind of place. A state with many audited lodging operators is not necessarily one with a large lodging economy, so the counts are a guide to where the sample found lodging, not a ranking.
Which kinds of lodging place scored best online?
Among the types with enough operators, coast, bays and barrier islands averaged 5.81 across 16 operators, mountains and foothills 5.52 across 29, lakes and reservoirs 5.06 across 16, and rivers, deltas and wetlands 4.87 across 15. Piedmont, plains and metro interior had only 8 operators and is not scored. The groupings are broad and judgment-based, and the samples are small, so treat the pattern as something to check against your own market rather than as a rule.
How do lodging sites compare with the rest of the audit?
Lodging and campground operators are somewhat stronger than the 1,546-operator benchmark. Mean digital health is 5.38 against 5.09, 31.0% score 4 or below against 39.8%, 17.9% score 8 or above against 12.3%, and 91.7% have their own website against 80.2%. FAQ content is on 44.3% of sites against 36.9%, and newsletter signup is 40.0% against 32.7%. The weak spots are booking, which is a floor, and FAQ markup, since only 3 of 70 sites use FAQ structured data.
Can a cabin or lodge advertise guided trips on nearby public land?
Only where the managing agency allows it. Many lodges, cabins and campgrounds sit beside national forests, wildlife refuges, wildlife management areas and state parks that regulate commercial use. Guiding on public land and water generally requires a permit or authorization from the managing agency, and the rules differ by agency and site. A lodge that offers guided trips should say where they happen and confirm the rules for each place with the managing agency before selling them. Camping in state and federal campgrounds is typically booked through the agency, not the lodge.
Related Reading
Inside the 2026-27 Outdoor Hospitality Report: State Tables, Lodging Types and Guest Calendars
Direct Bookings vs. Airbnb and VRBO: The Real Commission Math for Southeastern Cabin Rentals
Is Airbnb Bidding on Your Lodge's Name? How to Take Your Branded Search Back
Marketing on Lake Cumberland: The Houseboat Capital's Guide Economy and Striper-Trout Crossover


Comments