
Inside the 2026-27 Kentucky Outdoors Report: Federal Lakes, a Cumberland Tailwater and Guide Licensing
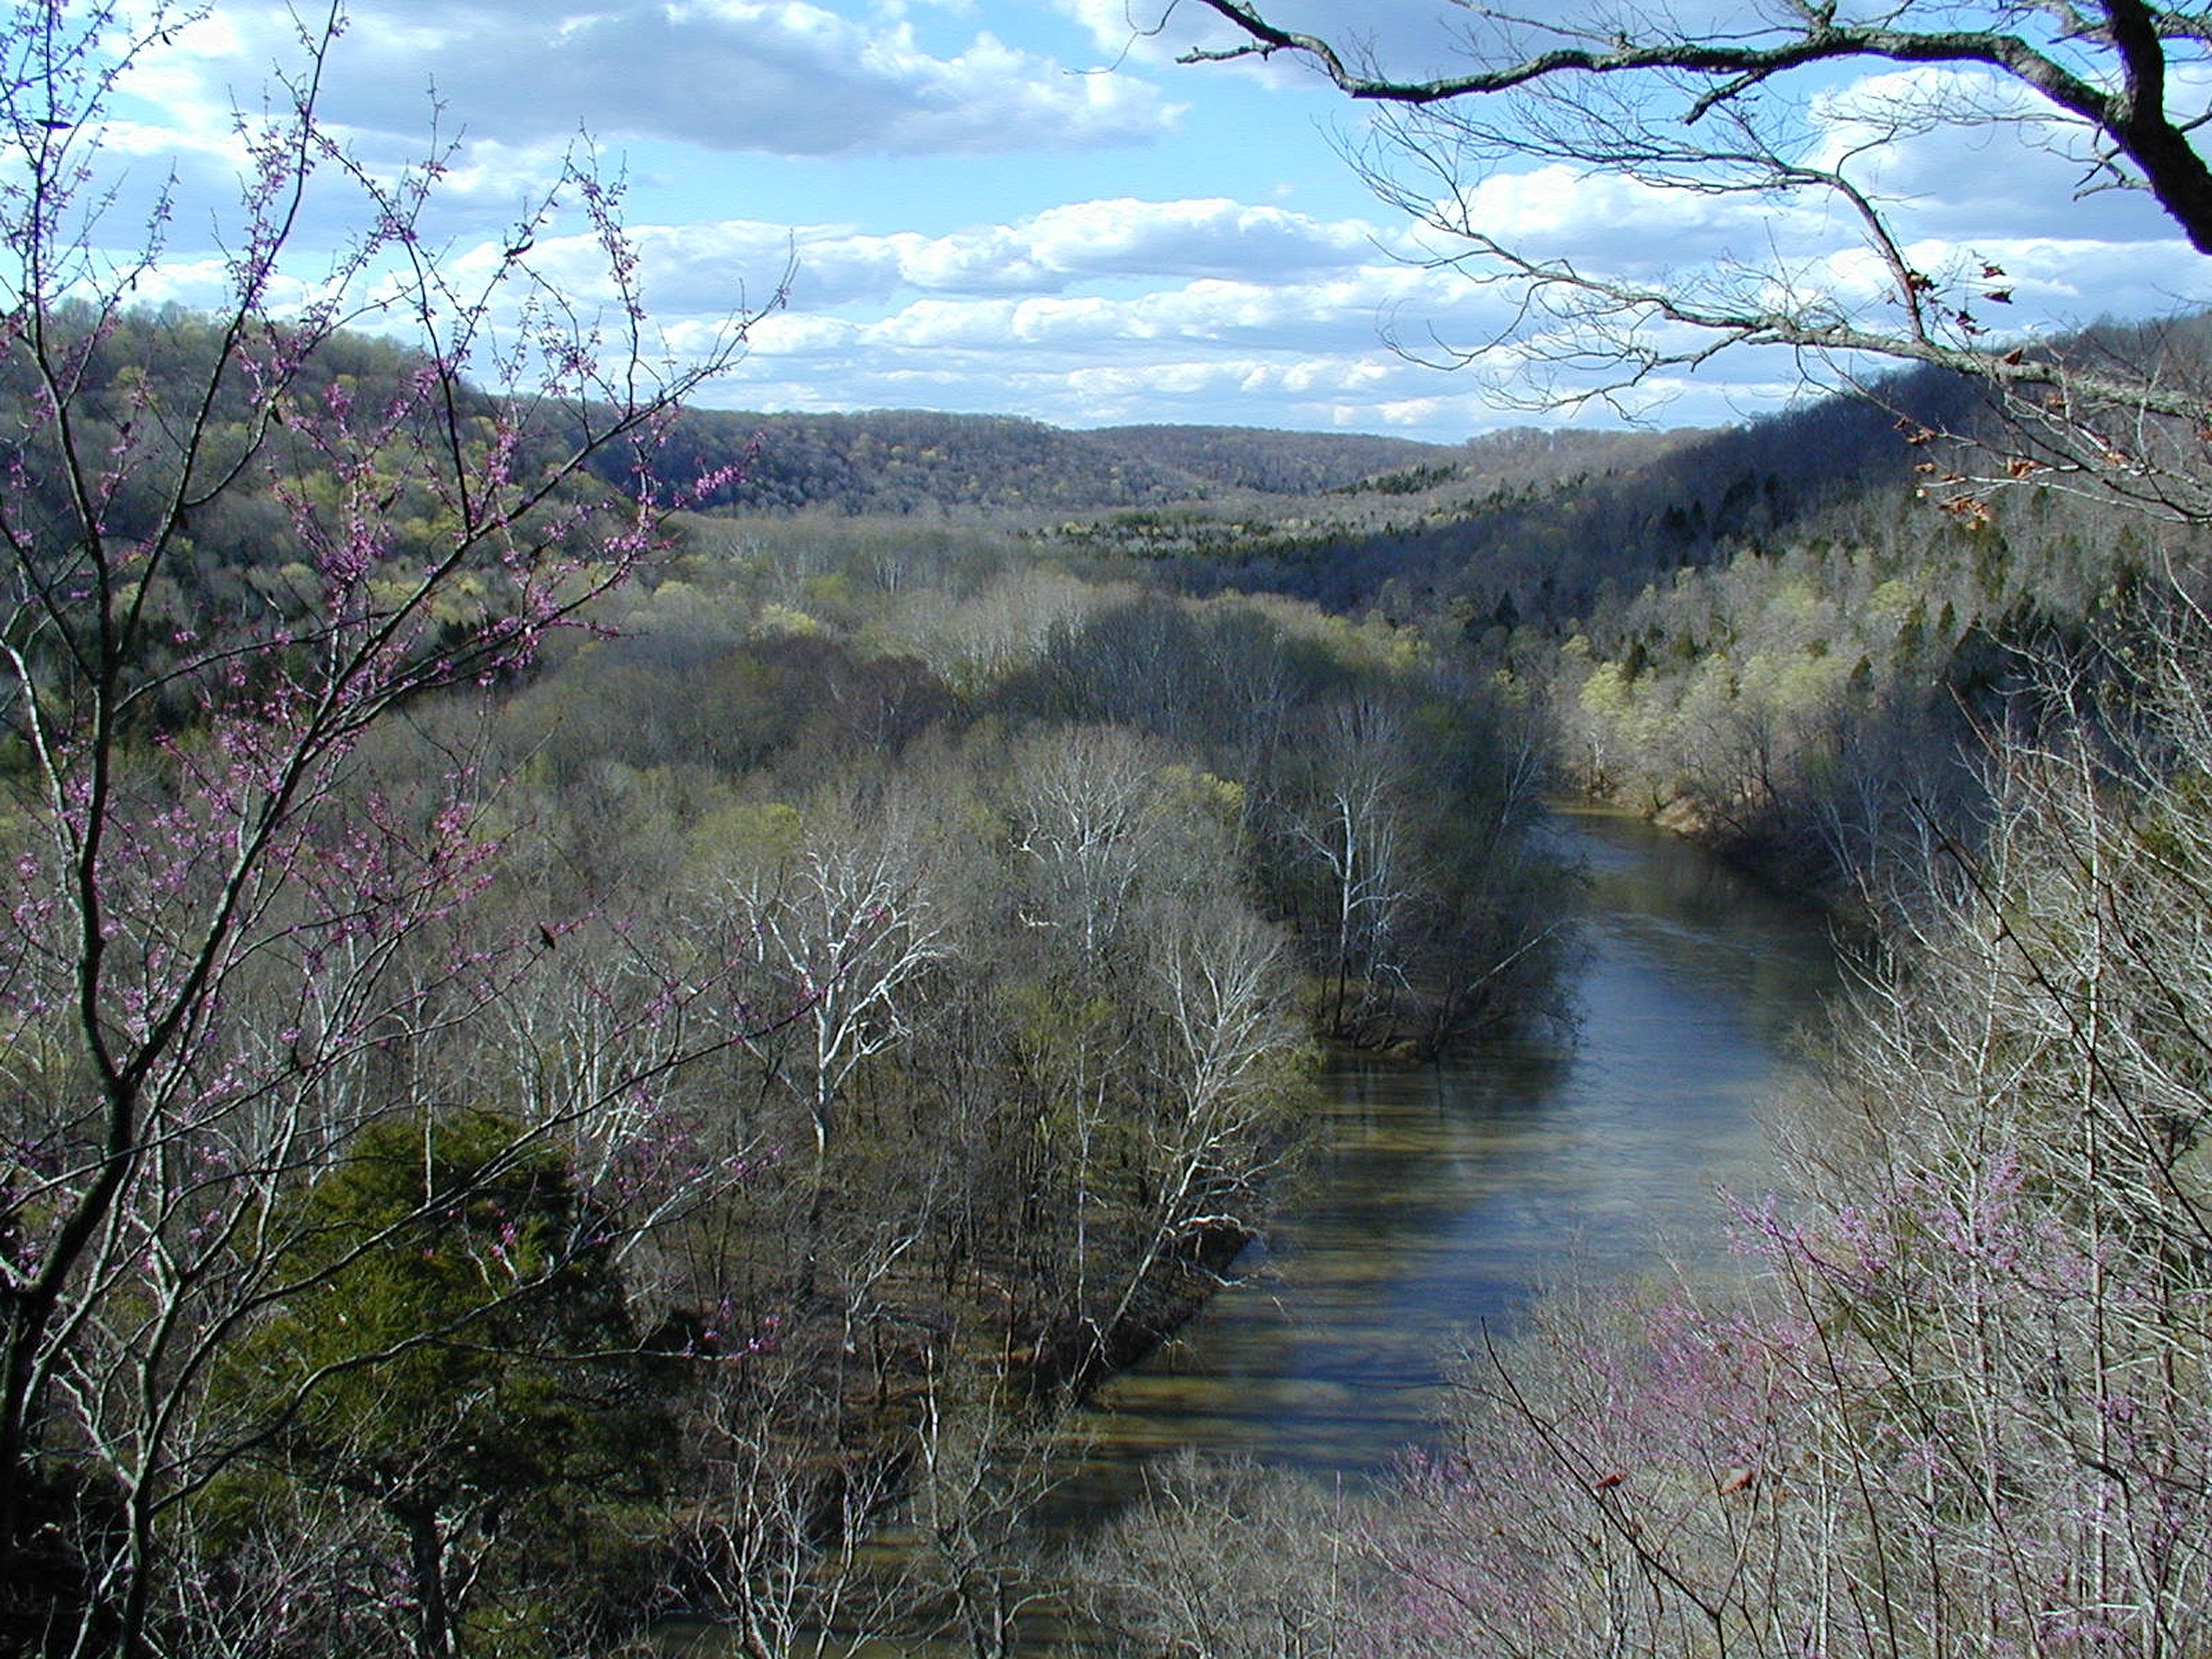
The 2026-27 Kentucky Outdoors report is a state-level look at the business of hunting, fishing, paddling and adventure travel in Kentucky. It puts public, primary-source data next to Pine & Marsh's October 2026 audit of private, for-profit outdoor businesses, 102 of them in Kentucky. The public data comes from the U.S. Bureau of Economic Analysis (BEA), the Kentucky Department of Tourism, the U.S. Fish and Wildlife Service, the U.S. Coast Guard, the Army Corps of Engineers, the Kentucky Department of Fish and Wildlife Resources (KDFWR) and federal land agencies.
It is written for guides, outfitters, marina owners, lodge operators and adventure companies who sell trips in Kentucky. Kentucky is an inland state, so the saltwater chapters other states carry are replaced here by lakes, rivers and the Cumberland tailwater. This post walks through the report chapter by chapter. For the marketing playbook, see Marketing a Sporting Operation in Kentucky: The Full State Guide.
At a Glance: Kentucky in Nine Numbers
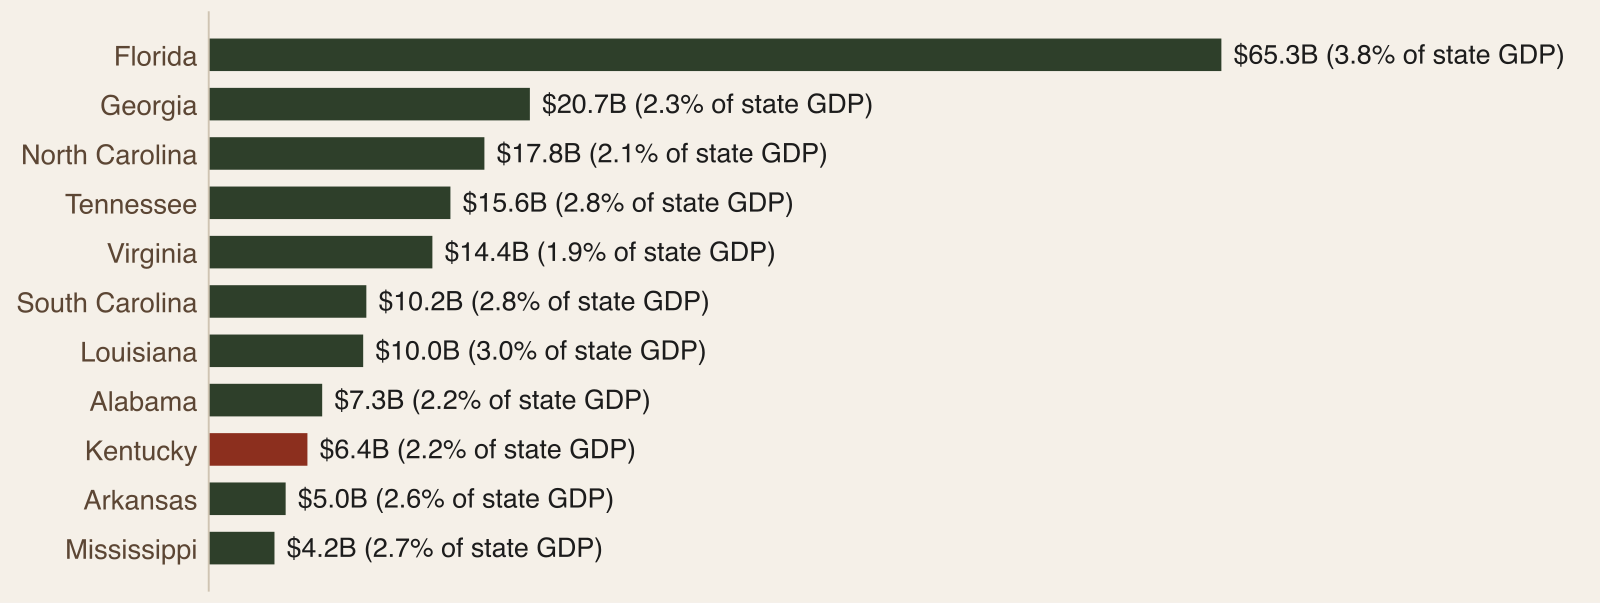
Outdoor recreation added $6.4 billion of value added in Kentucky in 2024, 4% of the eleven-state Southeast total, and was 2.2% of state GDP against 2.4% for the U.S. It employed 56K people. The state counted 81.1 million visitors in 2025.
The license numbers are mid-sized: 528K paid fishing license holders and 316K paid hunting license holders in license year 2024, with hunting at 6.9 per 100 residents, seventh of the eleven states. Kentucky had 142K registered recreational vessels, tenth of the eleven states by count.
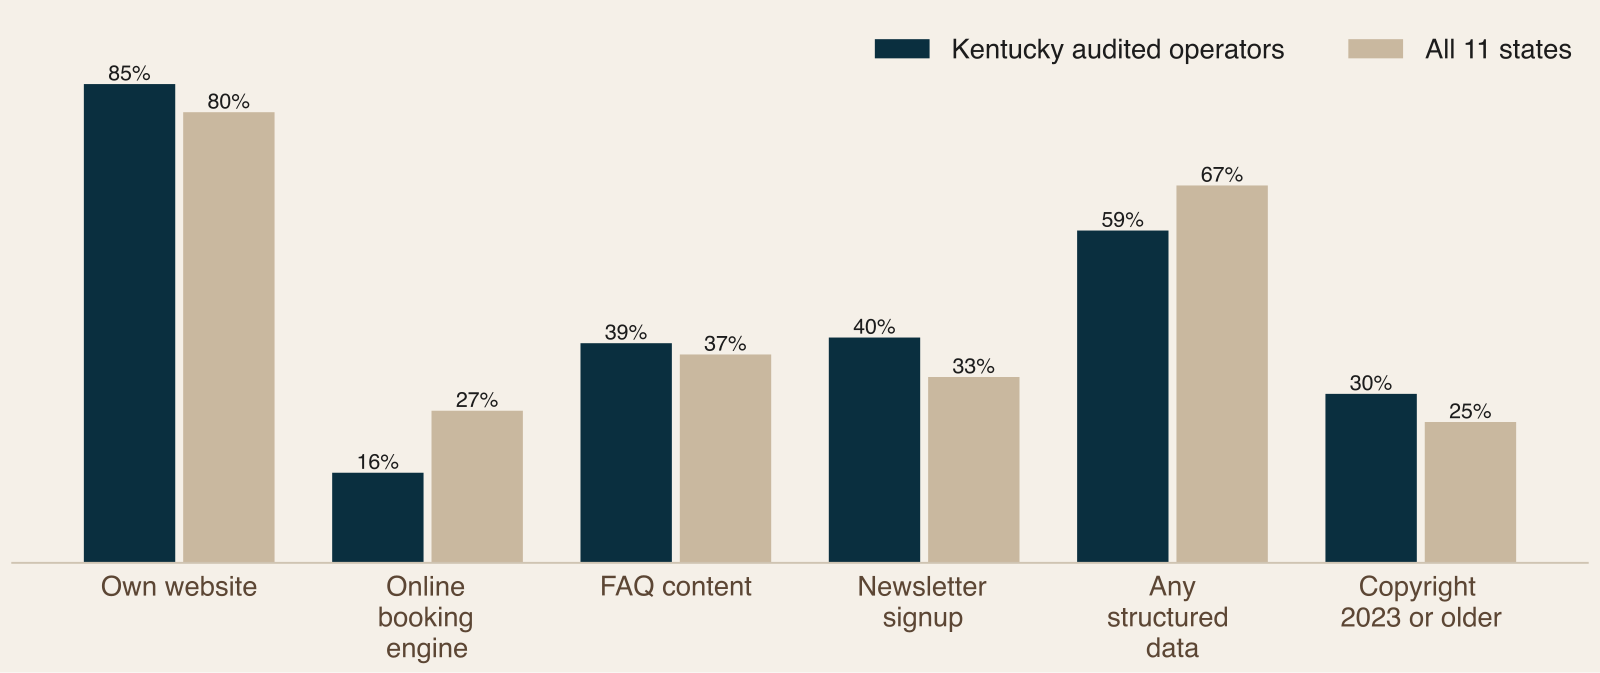
The two audit numbers close the picture. The 102 audited Kentucky operators score 5.04 out of 10 on digital health against 5.09 region-wide, sixth of the eleven states, and 16% of sites read show an online booking engine against 27%.
The Outdoor Economy: Among the Smaller in the Region
Kentucky's $6.4 billion is ninth of the eleven states by total and 0.9% of the national figure. Outdoor recreation employed 56,360 people, 2.7% of wage and salary jobs, the third-lowest count in the region. Its 2.2% share of GDP ties with Alabama for the third-lowest share.
The activity breakdown uses BEA's older 2023 vintage and is compared only within 2023. Kentucky ranked first in none of the nine lines, and its best rank was fourth of eleven, in equestrian, where it held 11% of the regional total. Water-based guided tours and charters produced $72M, 2% of the regional total, a line the report explains is weighted to coastal charter economies that an inland state does not have.
The visitor economy is measured separately. The Kentucky Department of Tourism counted 81.1 million visitors in 2025 who spent $10.4 billion, for a total economic impact of $14.6 billion. Southwick Associates put angler spending at $2.0 billion in 2022 and hunter spending at $1.60 billion. The report never adds these measures together. Every first-time guest of a Kentucky guide, marina or lodge arrives as one of these visitors first.
The report's most detailed activity table comes from BEA's older 2023 vintage, so it is compared only within 2023. In it Kentucky ranked tenth of eleven in boating and fishing ($280M), fishing excluding boating ($61M), guided tours and outfitted travel of all kinds ($146M) and RVing ($171M). It ranked eighth in climbing, hiking and tent camping ($73M, 5% of the regional total), ninth in hunting and trapping ($89M, 5%) and in shooting including archery ($97M, 6%), and fourth in equestrian ($162M, 11%). Within that vintage, outdoor value added moved from $4.7 billion in 2019 to $3.5 billion in 2020 and $5.6 billion in 2023, up 19% in current dollars, but BEA revised the series in March 2026, so the report does not join it to the 2024 figure.
The visitor and spending studies add texture. The 2025 tourism study counted 96,993 supported jobs, $3.6 billion in personal income and $1.1 billion in state and local tax revenue. Southwick Associates put angler spending at $2.0 billion from 554,150 anglers, supporting about 15,550 jobs, and hunter spending at $1.60 billion from 318,870 hunters. Target shooting added $1.0 billion from 566,000 participants, a separate and overlapping group. The report never adds these measures together, and neither should an operator quoting them.
Hunters and Anglers: Mostly Residents, With a Valuable Out-of-State Hunter
Kentucky counted 528,398 paid fishing license holders in 2024, the second-lowest total of the eleven states, and 315,758 paid hunting license holders, the fifth-lowest. Against 4.6 million residents, that is 11.5 fishing and 6.9 hunting license holders per 100 people. From 2020 to 2024, fishing license holders rose 3.7% after peaking at 593,612 in 2021, and hunting license holders rose 3.3%. The report treats the five-year spans as estimated ranges: roughly 306,000 to 321,000 hunting and roughly 509,000 to 594,000 fishing.
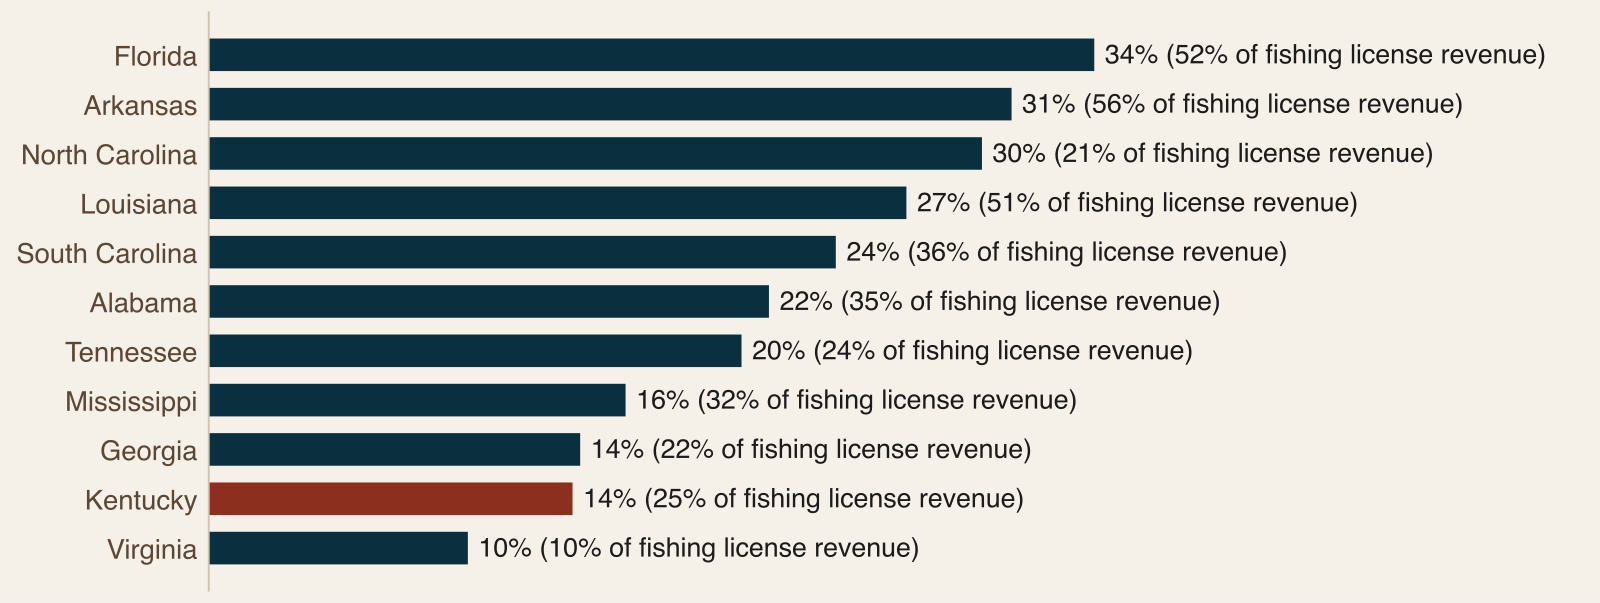
The nonresident split is lopsided. Nonresidents bought 24% of hunting items but paid 51% of hunting license revenue. For fishing they bought 14% of items, the second-lowest share in the region, and paid 25% of revenue.
The survey window is a different population. The 2022 National Survey, using Kentucky's state opt-in sample, counted about 435,000 hunters and 968,000 anglers. USFWS estimated about 12,500 active duck hunters in 2024-25 and about 20,000 active dove hunters in 2025-26. None of these figures should be added together or set against license counts as if they measured the same thing.
The certified license data show how lopsided the revenue is. In 2024 Kentucky sold 487,574 resident and 79,164 nonresident fishing items, bringing in $7.9 million and $2.7 million. For hunting it sold 423,497 resident and 135,518 nonresident items, bringing in $12.1 million and $12.7 million. Nonresident hunters therefore paid slightly more than residents in total, from about a quarter of the items. These count licenses, tags, permits and stamps, not people, because one person can buy several.
For a lodge or outfitter, the lesson is that a Kentucky hunting page is read twice, once by a resident who knows the state and once by a visitor who needs travel, lodging and licensing explained. Fishing is the reverse: it is mostly a resident product, and the second-lowest nonresident share in the region.
The Resource and the 2026-27 Seasons
The 2026-27 deer calendar opens with archery on September 5 and runs to January 18, with modern firearms November 14 to 29. KDFWR expects roughly 300,000 deer hunters. Mandatory check-in counted 145,433 deer in 2025-26, down 3% from 149,868 in 2024-25 and up 10% from 132,322 in 2021-22. A CWD response adds an antlerless-only firearms hunt September 25 to 28 in seven named counties.
Turkey is the standout. KDFWR reported spring harvests of 35,655 in 2023, 33,460 in 2024, 30,661 in 2025 and 36,439 in 2026, which the department called a record. The summer brood survey counted 3.5 poults per hen in 2025, up from 2.7 in 2024. The report's calendar table also covers dove, quail, grouse, woodcock, ducks, geese and sandhill crane, and notes that spring 2027 turkey dates were not yet posted when it was read. KDFWR's August release also reports 500 elk hunters selected in the May drawing.
Kentucky's best-documented trout water is the Cumberland River tailwater below Wolf Creek Dam, where KDFWR describes rainbow and brown trout and also lists walleye, sauger and striped bass. Limits differ by water and species, so a guide's website should link to KDFWR's current regulations rather than copy limits.
The season tables give an operator a working calendar. Youth-only firearms run October 10 to 18, early muzzleloader October 17 to 18, modern firearms November 14 to 29, late muzzleloader December 12 to 20 and a free youth weekend December 26 to 27. Statewide deer permits allow up to four deer, only one of them antlered, and zone limits apply. Fall turkey has shotgun seasons October 24 to 30 and December 5 to 11. Dove opens September 1, quail opens November 1 in the eastern zone and November 16 in the western zone and runs into early 2027, and ducks run November 26 to 29 and December 7 to January 31. Sandhill crane is by quota permit, with applications September 1 to 30.
Harvest history is steady. Reported deer harvests were 132,322 in 2021-22, 144,493 in 2022-23, 140,811 in 2023-24, 149,868 in 2024-25 and 145,433 in 2025-26. USFWS estimated a preliminary duck harvest of about 181,800 birds in 2024-25 and a dove harvest of about 353,300 in 2025-26. For bobwhite quail, the 2023 state profile reports a 67% decline in the Breeding Bird Survey index from 1960 to 2023. The report warns that KDFWR's August release said proposed regulation changes could still alter fall seasons, so dates belong on a page that links to the planner.
The Water: Lakes, Rivers and the Tailwater
There is no saltwater trip count for Kentucky. The Corps of Engineers counted 11.6 million visits across six projects in fiscal 2024, 1,119,106 of them for fishing (10%). Lake Barkley was the largest at 3.4 million visits, shared with Tennessee, and Lake Cumberland followed at 3.1 million visits with 388,949 fishing visits. Fishing was the largest share of visits at Green River Lake (15%). These are visits to federal projects, not guided trips.
Kentucky's state sample for the 2022 survey counted 968,000 anglers fishing in the state, 32% of them nonresidents, on 7.5 million trips. Angler expenditures were $2.5 billion, of which $551 million was trip-related.
The Cumberland tailwater deserves its own paragraph. KDFWR describes the 75-mile Kentucky portion as rivaling the White River in Arkansas and the Caney Fork in Tennessee. It also warns that the river rises quickly when generation begins at the dam, and generation schedules come from the Corps' Nashville District. The report's practical point is that a guide selling tailwater trips is selling a schedule-dependent product, so it is worth publishing how a trip changes when the water rises.
The Corps table shows how different the six projects are. Lake Barkley logged 3,351,603 visits, 371,550 of them for fishing (11%), and Lake Cumberland 3,070,959, with 388,949 fishing visits (13%). Rough River Lake had 1,690,195 visits and a 4% fishing share, Nolin Lake 1,439,447 and 5%, Barren River Lake 1,222,596 and 8%, and Green River Lake 818,880 and 15%. Motorized boating visits ranged from 104,440 at Nolin to 669,473 at Lake Cumberland. The Coast Guard counted 141,751 registered recreational vessels in 2024, up 0.2% from 141,525 in 2023, so the boating base is stable, not growing.
Public Land and the Rules for Guides
Kentucky licenses guiding itself. Under 301 KAR 3:150, hunting and fishing outfitter and guide licenses run March 1 through the last day of February. Applicants must be 18 or older, pass a background check and hold CPR and first aid certification. KDFWR's fee page lists a fishing guide license at $105.70 for residents and $422.80 for nonresidents. The state license is separate from any permit the land manager requires.
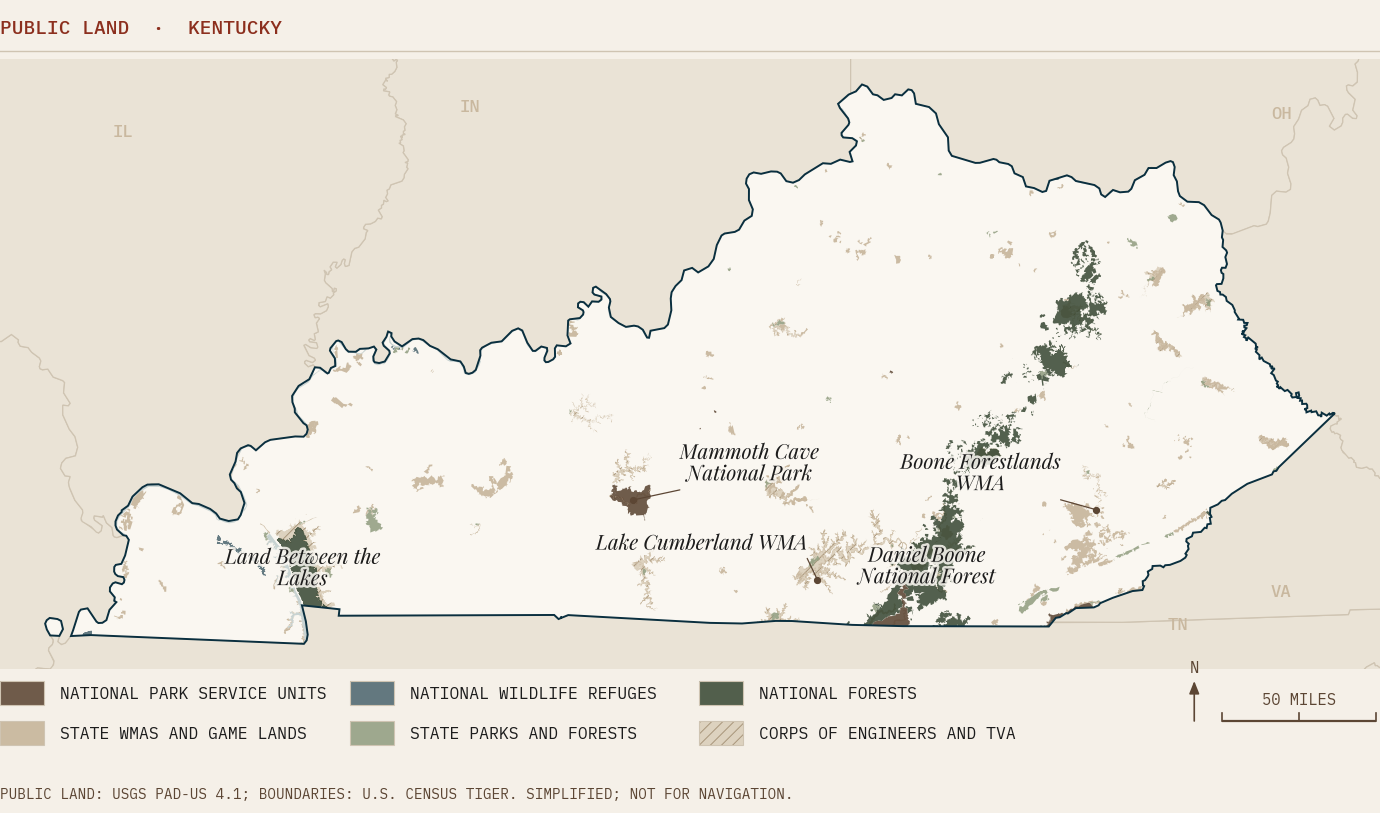
What the report finds, by land manager:
KDFWR public hunting land and WMAs: Over 1.5 million acres. The WMA rule prohibits activity that is commercial in nature and intent unless its event-permit exceptions apply, and it does not name guiding. The report does not tell readers that paid guiding is allowed on WMAs, so confirm with KDFWR before selling a guided trip on one.
Daniel Boone National Forest: 708,879 acres. The Forest Service says certain commercial uses, including guiding tours, require a special use authorization.
Land Between the Lakes: Any commercial operation requires a Special Use Permit, applications must arrive at least six months in advance and approval is not guaranteed.
Mammoth Cave National Park: A Commercial Use Authorization is required, and listed services include guided canoe and kayak trips on the Green and Nolin rivers (day trips only).
National wildlife refuges: Commercial enterprise is prohibited except by special permit.
Corps lakes: The report did not verify the Corps' rules, so confirm with the project office.
The report is clear that where a rule does not name guiding, that is not permission. It summarizes published rules and is not legal advice.
The licensing details matter if you hire. Outfitters are licensed in tiers set by the number of guides, and a guide works under a licensed outfitter of the same type. Fishing guiding is reported to KDFWR monthly, and hunting guides report each public land area where they guided. A U.S. Coast Guard captain's license can stand in for the boater education and CPR and first aid requirements. On the federal side, Land Between the Lakes is a 170,000-acre peninsula with about 110,000 acres in Kentucky, and Clarks River National Wildlife Refuge in western Kentucky is approximately 12,000 acres.
The Regions: Ten Sub-Regions, Only Three You Can Read as Numbers
The audit groups Kentucky into ten sub-regions, from Lake Cumberland to the Ohio River. Only three have at least 15 operators and 10 sites read: Lake Cumberland, the Green River and Mammoth Cave, and the Red River Gorge. The rest are described in words, with counts only.
Among the three, scores range from 4.18 in Lake Cumberland to 6.27 in the Red River Gorge. Lake Cumberland has 22 operators, mostly marinas, boat and houseboat rental (10), and no site read shows an online booking engine. The Green River and Mammoth Cave sub-region scores 4.93 with 15 operators. The Red River Gorge sub-region has 100% of operators with their own website and 46% of sites read showing online booking. Land Between the Lakes has fourteen operators and is described in words, with the six-month permit lead time noted.
The three readable sub-regions are worth comparing side by side. Lake Cumberland has 22 operators, 11 with a homepage that could be read, 50% with their own website and 27% with FAQ content. It scores 4.18, the fifth-lowest of 43 comparable sub-regions across the eleven states. The Green River and Mammoth Cave sub-region has 15 operators, 93% with their own website and 50% with FAQ content, scoring 4.93. The Red River Gorge has 15 operators, 100% with their own website and 62% with FAQ content, scoring 6.27, the third-highest of the 43. The smaller groups, such as 12 operators in the Bluegrass, nine around northern Kentucky and Cave Run and four in the western Kentucky wetlands, are described in words only.
The Operator Landscape: Level on Scores, Behind on Booking
The 102 audited operators have a mean digital health of 5.04, sixth of the eleven states, within the margin of noise of the region's 5.09.
85% have their own website, against 80% across the region.
38% score 4 or below, against 40%.
16% of the 75 sites read show an online booking engine, against 27%. FareHarbor is on 8 of the 12 sites with one.
39% carry FAQ content, but only two mark answers up as FAQ structured data.
40% offer a newsletter signup, against 33% regionally.
Kentucky's tier mix is close to the region's, with 29% top-tier against 32%. Within tiers, top-tier operators average 7.03 against 7.06, middle-tier 4.91 against 4.95 and lower-tier 2.96 against 2.84. Re-weighted to the region's mix, Kentucky's mean would be 5.09. The largest categories are marinas, boat and houseboat rental (26), paddle, kayak and canoe (16) and lodging and campgrounds (10).
The separate hunting audit (493 hunting operators, October 2026) counts 38 in Kentucky. Their mean digital health is 5.24 and 97% have their own website, but only 6% of the 36 sites read show online booking. By tag, whitetail leads with 27, followed by lodge or multi-program with 26 and turkey with 22.
By category, marinas, boat and houseboat rental is the largest group with 26 operators and a mean of 4.96 against 4.78 across the 132 in the eleven states. Paddle, kayak and canoe has 16 operators at 4.88 against 5.36 across 231. Where an online booking engine appears, FareHarbor is on 8 of the 12 sites, followed by Xola (2) and Peek (2). The report also notes that 30% of sites with a detectable copyright year still show 2023 or earlier, a cheap signal to fix before a season opens. Its definition of digital health is a 1 to 10 score assigned by researchers from observed evidence: a working, secure, mobile-friendly site, clear offers, reviews and recent activity. It describes how a business presents itself online, not the quality of its trips.
What It Means for Operators
Kentucky is a mid-sized outdoor economy with large federal lakes, a tailwater KDFWR compares to famous trout rivers and a state licensing system that guides need to understand. The operators sit level with the region on overall score and behind on booking, and most of the sub-regions are too small to rank.
The report's six moves are to sell the lake and the tailwater with the schedule, write for the visitor, close the booking gap, answer questions and mark them up, publish the permits you hold, and, for hunting operators, show the calendar. Its advice for this month is to make sure a visitor on a phone can find your homepage, see what a trip includes and which permits you hold, and hold a date in under a minute.
Get the Kentucky Report
The full report adds the audit tables, every chart with its source and year, the 2026-27 season calendar, the sub-region notes and the full source list.
Download the full 2026-27 Kentucky Outdoors report (free with your email).
Frequently Asked Questions
Does Kentucky license fishing and hunting guides?
Yes. Anyone who guides others in taking fish or wildlife for pay needs a KDFWR license under 301 KAR 3:150. Licenses run March 1 through the last day of February, and applicants must be 18 or older, pass a background check and hold CPR and first aid certification. KDFWR's fee page lists a fishing guide license at $105.70 for residents and $422.80 for nonresidents. A guide works under a licensed outfitter of the same type. The state license does not replace any permit a land manager requires, so check the agency for each place you guide.
Can I guide on Kentucky WMAs?
Unresolved, so confirm with KDFWR before selling a guided trip on a WMA. The WMA rule, 301 KAR 3:010, prohibits activity that is commercial in nature and intent unless its event-permit exceptions apply, and it does not name guiding. The report does not tell readers that paid guiding is allowed on WMAs, and it does not say it is banned. Its point is that a rule that does not name guiding is not permission. Ask the agency about the exact area and keep the answer in writing.
Which Kentucky public lands need a permit for guided trips?
Each manager has its own rule. Daniel Boone National Forest, which covers 708,879 acres, requires a special use authorization for certain commercial uses including guiding tours. Land Between the Lakes requires a Special Use Permit for any commercial operation, with applications at least six months ahead and no guarantee of approval. Mammoth Cave National Park requires a Commercial Use Authorization, and guided river trips are listed as day trips only. Refuges prohibit commercial enterprise except by special permit, and for Corps lakes you should confirm with the project office.
How big are Kentucky's lakes for outdoor business?
The Corps counted 11.6 million visits across six projects in fiscal 2024, with 1,119,106 fishing visits, about 10%. Lake Barkley was largest at 3.4 million visits, shared with Tennessee, and Lake Cumberland had 3.1 million, with 388,949 fishing visits. Fishing was between 4% and 15% of visits at each project, highest at Green River Lake. These are visits to federal projects, not guided trips, so they describe the setting a guide sells into rather than the size of the guiding market.
What did the 2026 turkey season look like?
KDFWR reported a spring 2026 harvest of 36,439, which the department called a record, up from 30,661 in 2025 and 33,460 in 2024. The 2023 harvest was 35,655. The summer brood survey counted 3.5 poults per hen in 2025, up from 2.7 in 2024, which bears on future seasons. The 2026 season ran April 18 to May 10, with a youth weekend April 4 to 5. Spring 2027 dates were not posted on the KDFWR planner when the report was read, so confirm before publishing dates.
How important are nonresident hunters in Kentucky?
Very, by revenue. Nonresidents bought 24% of hunting items in 2024 but paid 51% of hunting license revenue, $12.7 million against $12.1 million from residents. For fishing they bought 14% of items, the second-lowest share in the region, and paid 25% of revenue. An outfitter selling to out-of-state hunters should write for a buyer who needs lodging, licensing and season information explained, while a fishing guide is mostly selling to residents and nearby visitors.
How do Kentucky operators compare online?
The 102 audited operators average 5.04 against 5.09 region-wide, about level and sixth of the eleven states. The gap is booking: 16% of the 75 sites read show an online booking engine against 27%, and no site read in the Lake Cumberland sub-region shows one. Red River Gorge scored 6.27 with 46% showing online booking. Only two sites mark up their FAQ answers as structured data, though 39% carry FAQ content. Site signals come from a homepage scan on October 17, 2026, so they are lower bounds.
What are the report's six moves for operators?
Sell the lake and the tailwater with the schedule, because KDFWR says the Cumberland rises quickly when generation starts. Write for the visitor, since Kentucky counted 81.1 million visitors in 2025. Close the booking gap by testing the path from a phone each season. Answer questions and mark them up with FAQ structured data. Publish the permits you hold, such as your KDFWR license or a Commercial Use Authorization. Hunting operators should show the calendar, because only 6% of audited hunting operators show online booking.
Sources
U.S. Fish and Wildlife Service, certified hunting and fishing license data, license years 2020 to 2024
USGS Gap Analysis Project, PAD-US 4.1, for the public-land map
Kentucky Department of Fish and Wildlife Resources seasons planner, deer page, tailwater and licensing pages, and 301 KAR 3:150 and 3:010, read October 2026
Kentucky Department of Tourism, Economic Impact of Tourism in Kentucky, 2025 (published May 2026)
Pine & Marsh Southeast audit, October 2026 (1,546 operators), and the Pine & Marsh hunting audit, October 2026 (493 operators)
Related Reading
Marketing a Sporting Operation in Kentucky: The Full State Guide
Inside the 2026-27 Tennessee Outdoors Report: Tailwaters, Hunters and 150 Million Visits
Inside the 2026-27 Whitetail Report: Why You Cannot Rank Deer Harvest by State
Inside the 2026-27 Virginia Outdoors Report: From the Chesapeake to the Blue Ridge


Comments