
Inside the 2026-27 Whitetail Report: Why You Cannot Rank Deer Harvest by State
Whitetail in the Southeast, 2026-27 Edition, is the first of Pine & Marsh's industry reports. It looks at deer hunting demand, the harvest record in each of 11 states, and the digital storefronts of the region's whitetail guides, outfitters and lodges. It combines public data from state wildlife agencies, the National Deer Association, the U.S. Fish and Wildlife Service, the Bureau of Economic Analysis and Southwick Associates with a Pine & Marsh audit of hunting businesses.
It is for whitetail guides, outfitters, lodge owners and lease managers who want to know how big the market is, how the deer numbers should and should not be read, and where operators like them stand online. This post walks through each chapter in order. For the marketing playbook, see Marketing a Whitetail Deer Hunting Outfitter in the Southeast.
The Industry in Nine Numbers
The opening page sets the scale. The U.S. had 14.4M hunters age 16 and older in 2022, and the 11 Southeast states had 4.71M paid hunting license holders in 2024, which is 29.9% of the U.S. total. BEA value added from hunting, shooting and trapping was $16.5B in 2024, up 95% from 2019, though that total is not deer alone.
The audit numbers follow. The sample has 178 whitetail operators, 36% of the 493 audited hunting operators. Their mean digital health score, on a 1 to 10 scale, is a hundredth of a point below the 5.23 for all audited hunting operators and just above the 5.09 Southeast benchmark. Then come the gaps: 7% show an online booking engine against 27.0% in the benchmark, 23% have FAQ content against 36.9%, and 16% offer a newsletter signup against 32.7%.
Demand: Hunters and Licenses
No public source counts everyone who hires a whitetail guide, and none counts deer hunters on their own. The widest federal measure is the 2022 National Survey, which found 14,374,589 hunters age 16 and older nationally. About 11.5 million hunted big game, a group that includes deer, elk and bear, so that figure is an upper bound for deer hunters. Hunters spent $45.2 billion in 2022.
Hunting is rural and regional. 6% of Americans 16 and older hunted in 2022, but 12% of rural residents did, against 4% of urban residents. The East South Central division (Alabama, Kentucky, Mississippi and Tennessee) had the highest participation rate in the country at 10%. Women were 22% of hunters.
License data show the market over time. The 11 states had 4,714,399 paid hunting license holders in 2024, up 1.1% since 2020 against 2.4% nationally. That is a stable base, not a growing or collapsing one. Density varies sharply: Arkansas has 10.7 holders per 100 residents, Tennessee 10.1 and Louisiana 9.8, while Florida has 1.1 and Virginia 2.9. The ratio includes nonresident buyers, which is why it overstates residents in destination states. Georgia (up 9%) and Florida (up 30%) gained holders from 2020, while North Carolina (down 8%) and Alabama (down 6%) lost them.
Two cautions matter. Tennessee's and Florida's jumps may reflect reporting changes, and a license is not a deer hunter, since the data do not separate deer, turkey and small game licenses. The report's own framing is the right one: these figures describe the pool a guide draws from, not the size of the guided market.
The Resource: Deer Harvest by State
This is the chapter that changes how you read deer numbers. There is no federal count of deer harvest. Each state counts its own, and the methods differ: mandatory check-in, check-in adjusted for non-reporting, hunter survey, or more than one. Mississippi has no mandatory reporting and no agency total at all.
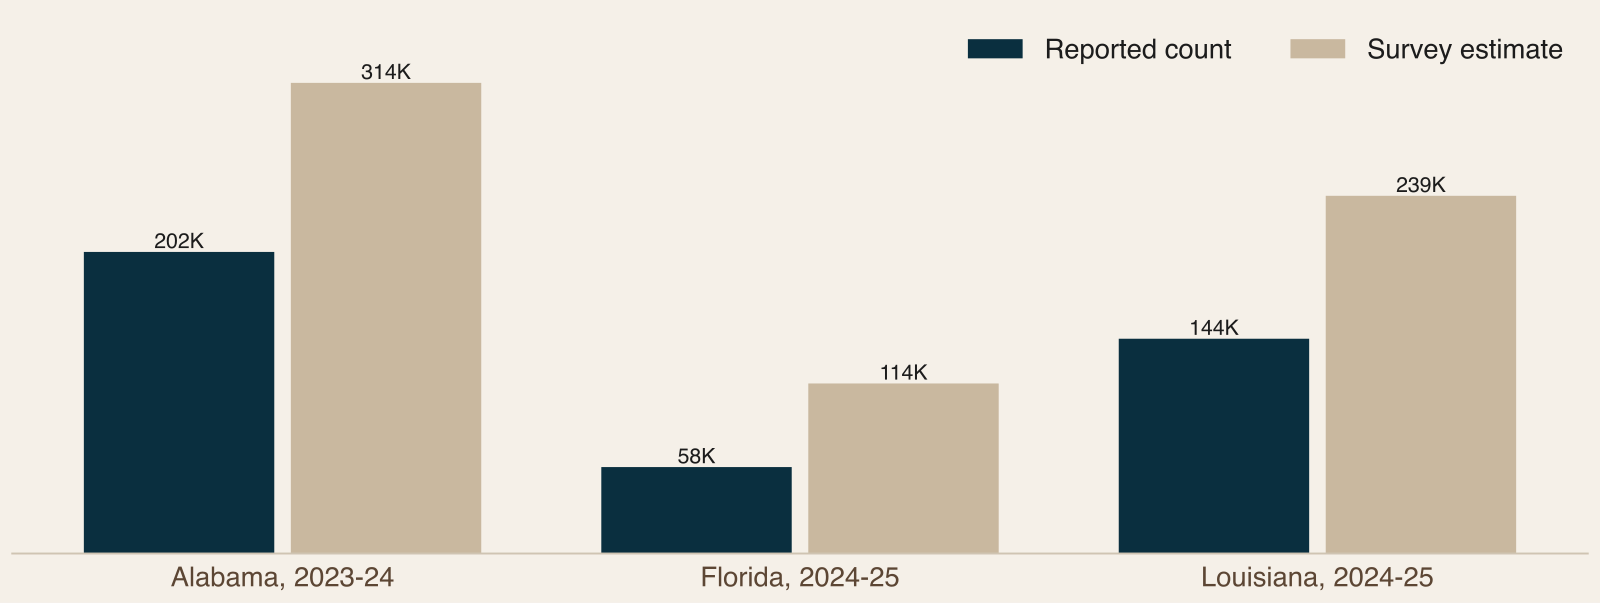
The gap between methods is large. Florida's survey estimate for 2024-25 was 113,629 against a reported count of 57,772, which is 97% higher. Alabama's 2023-24 estimate was 56% above its reported count and Louisiana's 2024-25 estimate 67% above. For that reason the report does not rank states by harvest, and it lists them alphabetically with the counting method beside each.
What you can compare is a state against itself:
In the five mandatory check-in states, harvest from 2022-23 to 2025-26 rose 22% in North Carolina and 23% in Virginia (a preliminary figure), and was roughly flat in Arkansas (0%) and Kentucky (up 1%). Tennessee's unproofed figure was down 6%.
The National Deer Association series, which covers all 11 states from 2022-23 to 2024-25, shows harvest rising in 10 of 11, flat in South Carolina, and rising most in Florida (22%, a survey-based series), North Carolina (15%) and Virginia (10%). Over two seasons these changes say little about long-run trends.
Antlerless deer were more than half of the 2024-25 harvest in Mississippi, Alabama, Georgia, Arkansas and Virginia, and under half in the rest, with Florida lowest at 36%.
The report deliberately gives no season dates, bag limits or antler rules, since those are set by each state agency and change yearly. It also does not measure deer population, herd health or disease.
The buck and doe mix adds a second lens, because it depends less on how completely a state counts. Antlerless share of the 2024-25 harvest was 57% in Mississippi, 55% in Alabama, 53% in Georgia, and 51% in both Arkansas and Virginia. It was 49% in South Carolina, 48% in Kentucky and North Carolina, and 46% in Louisiana and Tennessee, with Florida lowest at 36%. Definitions differ, since some states count button bucks as antlerless, so the shares are indicative. For an operator the mix signals what hunters are taking, buck-only or any deer, and what a hunt can promise.
The state table in the report gives each state's latest season, how it was counted, and the change from the season before using the same method. Alabama's 2024-25 Game Check count was 205,913 (up 2%). Arkansas was 185,922 in 2025-26 (down 7%), Florida's survey estimate 113,629 in 2024-25 (up 23%), Georgia's adjusted count 274,134 in 2024-25 (down 8%) and Kentucky's telecheck 145,433 in 2025-26 (down 3%). Louisiana's survey index was 276,200 (up 16%), the National Deer Association compilation for Mississippi 271,289 (down 1%), North Carolina's registration count 199,770 (up 6%), Tennessee's unproofed 153,294 (down 9%) and Virginia's preliminary 227,302 (up 10%). South Carolina's 190,707 is marked not comparable, because 2024-25 was the first year of mandatory reporting and 2023-24 was a survey estimate of 198,171. Read down a column of changes, never across a column of totals.
On public land the report is plain. Much of the region's deer hunting happens on wildlife management areas, national forests and national wildlife refuges. Commercial guiding there generally requires a permit or special-use authorization from the managing agency, and some units do not allow it at all. Do not advertise or sell a public-land hunt without the permit for that unit, and confirm with the managing agency, such as KDFWR for a Kentucky WMA.
Where It Happens
Deer are hunted in every state, but the audit finds guides, outfitters and lodges concentrated in a few. Of the 178 audited whitetail operators, Alabama has 43 (24%), and Alabama, Kentucky, North Carolina, South Carolina and Georgia together hold 128 (72%). The audit says that reflects what it could verify and not the size of each state's deer hunting.
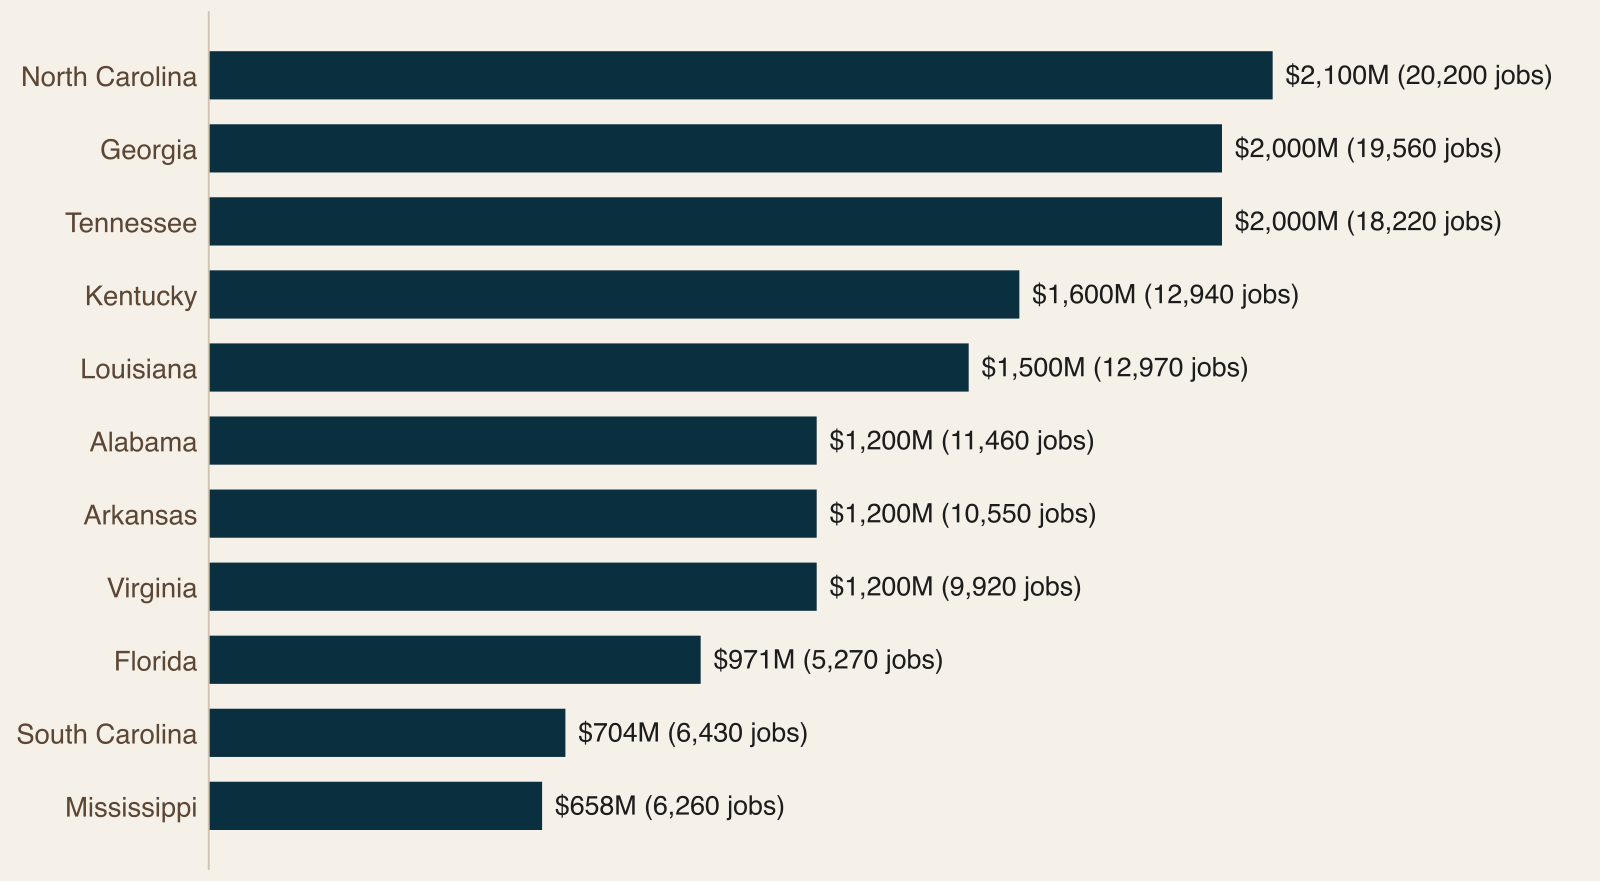
Public spending data sit beside that. Southwick Associates' 2022 estimates put hunting spending highest in North Carolina ($2,100M), Georgia ($2,000M) and Tennessee ($2,000M) and lowest in Mississippi ($658M). Those figures cover all hunting, not deer alone.
The report's state table sets those figures side by side. Alabama has 43 audited whitetail operators and $1,200M in hunting spending, Kentucky 27 and $1,600M, North Carolina 24 and $2,100M, South Carolina 18 and $704M, and Georgia 16 and $2,000M. Arkansas, Florida, Louisiana, Tennessee and Virginia have 9, 9, 9, 9 and 8, and Mississippi has 6. Across the 11 states the total is $15,133M. Spending includes hunters who travel in from other states, so it shows where hunting money lands and not where each hunter lives.
As a share of each state's audited hunting operators, whitetail is largest in Kentucky (71%) and Alabama (65%) and smallest in Mississippi (18%). Six states, Arkansas, Florida, Louisiana, Mississippi, Tennessee and Virginia, have fewer than 15 audited whitetail operators each (50 combined), too few to describe with percentages. The report also says the data do not measure how much hunting happens on private, leased or public land, so it gives no share.
The Business Landscape
The 178 whitetail operators come from the 493-operator hunting audit, which is separate from the 1,546-operator Southeast benchmark. 99% have their own website, and 175 of the 178 sites returned a page and were read. Mean digital health is a hundredth of a point below the 5.23 for all audited hunting operators, and 32% score 4 or below, against 34% for all audited hunting operators.
Whitetail is rarely sold alone. Only 15 of the 178 (8%) carry no other species tag. 111 (62%) are also tagged for turkey, 99 (56%) as lodges and 58 (33%) for wild hog. Of the 124 audited operators with a turkey tag, 111 (90%) also carry whitetail. For the website, that means a deer buyer lands on a homepage that is often also selling turkey, hogs and lodging and has to find the whitetail page and its dates fast.
Whitetail also sits in the middle of the eight species tags the audit tracks. Mean digital health runs from 5.87 for sporting clays and 5.82 for lodges down through wild hog (5.56), waterfowl (5.32), turkey (5.30) and upland (5.29) to whitetail and dove (5.11), and whitetail has the lowest mean of the eight except dove. Its newsletter rate, 16%, is the lowest of all eight. The spread among tags is small. Beyond turkey, lodges and hog, 41 whitetail operators also carry an upland tag and 34 carry waterfowl.
By state, five have enough operators to show: Alabama (mean digital health 4.56), Kentucky (5.41), North Carolina (5.21), South Carolina (5.39) and Georgia (6.25). The report tells readers to treat state differences smaller than about 10 percentage points, or half a point of score, as noise at these sample sizes. It also shows that how the sample was found matters: the 133 operators newly verified in October 2026 average 5.40 and the 45 drawn from the Southeast audit 4.69. Read the result as a range, not a point.
How Buyers Search and Book
The audit shows what a visitor finds on a homepage, not how any one buyer searches. What it does show is thin:
The report adds general guidance on what buyers look for. They tend to start with a place and a species, such as a county, a lake, a region or a state plus "deer hunting guide", "whitetail hunt" or "deer lodge". Then they look for what the hunt includes and how to reserve it, which weeks are open, what land the hunt is on and how big it is, the weapon and the kind of deer a guest may take, how many hunters per party, what licenses and tags the guest must bring, and what happens in bad weather or when the deer do not move. This is guidance, not measured behavior, but each answer is a short page section a competitor in the same state may not have.
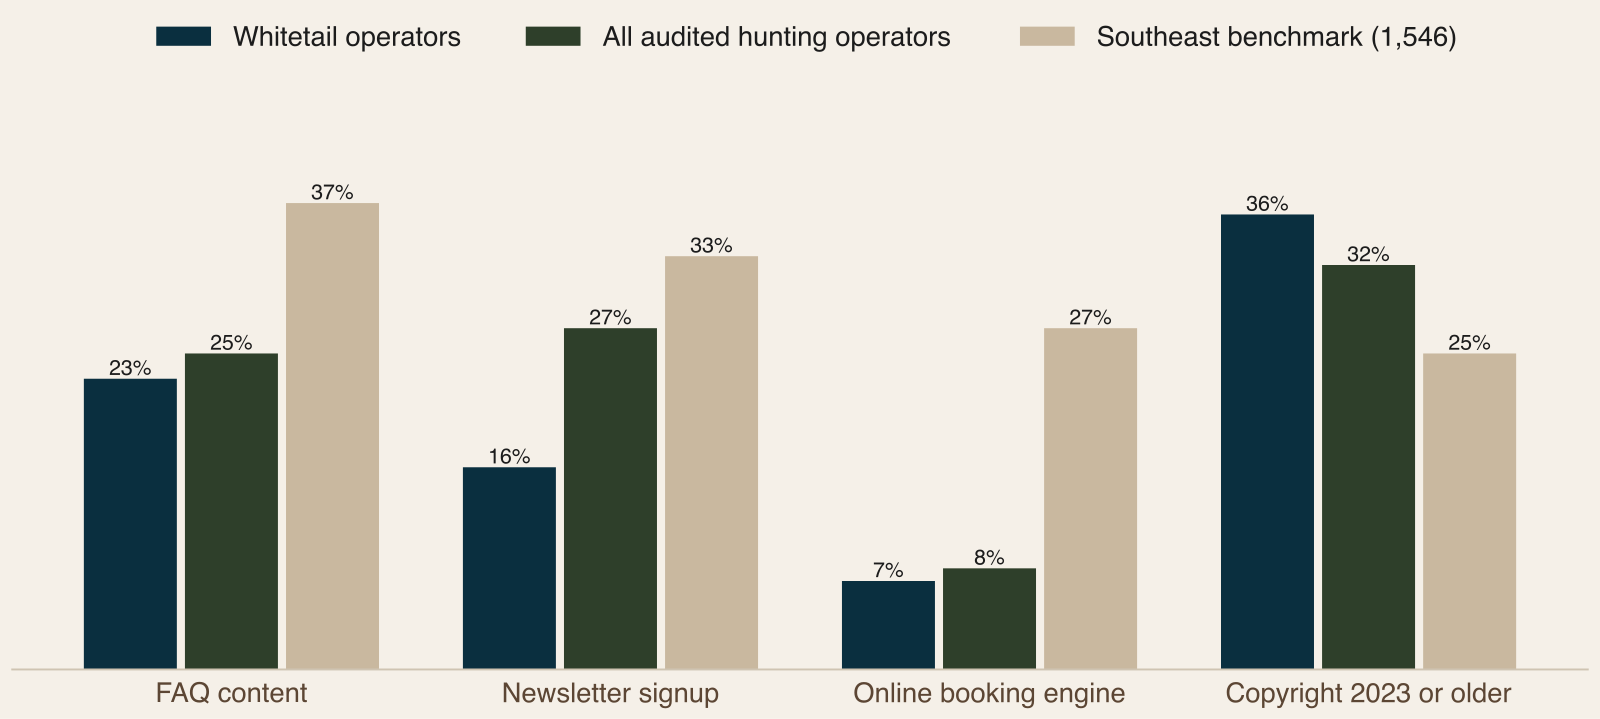
7% of the 175 whitetail sites show an online booking engine (13 sites), level with 8% for all hunting operators and far below 27.0% in the benchmark.
23% of homepages carry FAQ content, and only 3 of 175 mark answers up with FAQ structured data, although 58% have some structured data, much of it added automatically by website builders.
16% offer a newsletter signup, the lowest of the eight species tags.
36% of sites with a detectable copyright year show 2023 or earlier, against 25.0% in the benchmark.
A low booking rate is not a surprise for hunts sold by phone and deposit. It is still a gap, because a buyer who finds the site at ten at night has nothing to act on until morning. These rates are lower bounds, since a feature may sit deeper in a site, and the audit records whether a booking engine is present but not which one.
The Season and Booking Calendar
The report's calendar is general guidance, not measured data and not a set of state season dates. It splits the year into six phases: winter after the season, spring, summer, early fall, main season and late season. The pattern it describes is that whitetail demand peaks in the fall and early winter, most of the selling is done before the season starts, and the best-informed buyers book when state dates are announced.
Its practical advice is to build your own calendar. Note when inquiries start, when bookings peak and when they drop away, and publish your weeks a little earlier than feels necessary.
The phase detail is useful as a checklist. In winter after the season, thank guests, collect reviews and photos with permission and offer returning guests first choice of next year's weeks. In summer, publish next season's weeks, party sizes and policies with a note that dates follow the state's published season, and open a waiting list that goes to past guests first. In early fall, post season dates as soon as the state does, put availability and a deposit step on the booking page, and update the FAQ for current licenses and tags. In the main season, keep availability current and answer messages the same day. In the late season, say what a late hunt offers and what it does not. Season dates are set by each state and differ by zone, weapon and land type, so check the current regulations.
Six Moves for Operators
The report closes with six moves: publish next season's weeks, policies and availability early; make it possible to book or hold a date online; answer buyers' questions and mark them up; say where and on what authority you hunt; give whitetail its own page and link it to what else you sell; and keep a list and use it. If you can do one thing this month, put the season's weeks and a way to hold a date on the homepage, and make it work on a phone.
What It Means for Operators
The market is large and steady, so the work is not finding more hunters. It is being the operator a deer hunter can understand and book. The deer numbers will not tell you which state is "best", because they cannot, so do not market on that kind of ranking. The audit tells you where the storefront gap is: online booking, answers and email.
Whitetail buyers are also turkey and lodge buyers, so a clear path from one hunt to the next is worth building. And say plainly what land you hunt and on what authority, because on public land the permit matters.
Read the Full Whitetail Report
The full report has every table, the state-by-state audit detail and the methodology.
Download the full 2026-27 Whitetail report (free with your email).
Frequently Asked Questions
Can I rank states by deer harvest?
No, and the report does not. States count deer by mandatory check-in, check-in adjusted for non-reporting or hunter survey, and Mississippi has no agency total, only a National Deer Association compilation. Where one state reports both ways the gap is large: Florida's survey estimate is 97% above its reported count, Alabama's is 56% above and Louisiana's 67% above. The report lists states alphabetically with the counting method beside each, and compares a state only with itself across seasons.
How many deer hunters are there in the Southeast?
No public source counts deer hunters on their own. The 11 states had 4,714,399 paid hunting license holders in 2024, 29.9% of the U.S. total, but a license holder is not necessarily a deer hunter, the data do not separate deer, turkey and small game licenses, and one hunter can hold licenses in several states. Nationally, about 11.5 million hunters hunted big game in 2022, a group that includes deer, elk and bear, so that is an upper bound.
How do whitetail operators compare online with other hunting operators?
They look much alike. Mean digital health for the 178 audited whitetail operators is a hundredth of a point below the 5.23 for all 493 audited hunting operators, and the Southeast benchmark is 5.09. The gaps are specific: 7% show online booking against 27.0% in the benchmark, 23% have FAQ content against 36.9%, and 16% offer a newsletter signup against 32.7%. All rates come from homepage scans and are lower bounds.
Why do so few whitetail sites offer online booking?
Many hunts are sold by phone and deposit, so a low rate is not a surprise, and the audit records only whether a booking engine is on the homepage, not why it is missing or which one it is. It is still a gap, because a buyer who finds the site at ten at night has nothing to act on until morning. A date-hold form or deposit link gives that visitor something to do.
What does the antlerless share tell an operator?
Antlerless deer were more than half of the 2024-25 harvest in Mississippi (57%), Alabama (55%), Georgia (53%), Arkansas (51%) and Virginia (51%), and under half elsewhere, with Florida lowest at 36%. The share depends less on how completely a state counts, though some states count button bucks as antlerless, so it is indicative. For an operator it signals what hunters are taking, buck-only or any deer, and what a hunt can promise.
How big is the audit sample, and is it a census?
It is a sample, not a census. The hunting audit covers 493 businesses, 314 newly verified in October 2026 and 179 drawn from the 1,546-operator Southeast audit, and 178 of them carry a whitetail tag. Only operators confirmed as operating were counted, and small groups, such as the six states with fewer than 15 whitetail operators each, are described in words instead of percentages. Differences under about 10 percentage points, or half a point of score, are noise.
When should an outfitter publish next season's weeks?
Earlier than feels necessary. The report's calendar says most selling is done before the season starts and the best-informed buyers book when state dates are announced. Publish weeks, party sizes and policies in summer, post season dates the day the state does, and offer returning guests first choice. Dates are set by each state and differ by zone, weapon and land type, so link to current regulations.
Can a guide sell deer hunts on public land?
Only with the managing agency's authorization. Guiding on wildlife management areas, national forests and national wildlife refuges generally requires a permit or special-use authorization, and some units do not allow it at all. National forests need a U.S. Forest Service special-use permit, and National Park Service units need a commercial use authorization or concession contract. Confirm with the managing agency before you advertise a public-land hunt.
Sources
U.S. Fish and Wildlife Service, Wildlife and Sport Fish Restoration Program, certified paid hunting license holders, license years 2020 to 2024
U.S. Bureau of Economic Analysis, Outdoor Recreation Satellite Account, March 2026 release (2024 data)
National Deer Association, Deer Report 2026, 2024-25 season compiled from state agencies
State wildlife agency deer harvest reports for the 11 states (2020-21 to 2025-26 seasons), Southwick Associates for the Sportsmen's Alliance Foundation (2022 data), as cited in the report
Pine & Marsh hunting audit, October 2026 (493 operators), and the Pine & Marsh Southeast audit, October 2026 (1,546 operators), used as the benchmark
Related Reading
Marketing a Whitetail Deer Hunting Outfitter in the Southeast
Inside the 2026-27 Wild Turkey Report: Record Harvests, Weak Hatches and Who Sells the Hunt
Inside the 2026-27 Wild Hog Report: A $3.4 Billion Problem and a Market Sold as an Add-On
Inside the 2026-27 Georgia Outdoors Report: The Region's Biggest Hunting Market, Chapter by Chapter


Comments