
Inside the 2026-27 Saltwater Offshore Report: Where For-Hire Spending Is and Who Books Online
Offshore charter fishing is a high-ticket, weather-driven for-hire market served by a small group of captains who do the basics well online and trail on the rest. The 2026-27 Saltwater Offshore in the Southeast report, part of the Pine & Marsh Research industry series, sets NOAA Fisheries, U.S. Coast Guard and Bureau of Economic Analysis data beside our October 2026 audit of 1,546 outdoor businesses in 11 Southeastern states.
It is written for charter captains, party-boat operators, marinas and coastal lodges that sell for-hire trips. Offshore charter fishing happens in the eight coastal states, and the report covers those eight. One caution runs through every chapter: no public source isolates offshore, so most demand figures describe the for-hire market as a whole, inshore included.
At a Glance
Nine numbers open the report. On demand, charter boats made 2.02 million trips in 2025 across seven states with MRIP estimates, inshore and offshore combined, up 3% from 1.95 million in 2021. That is 1.9% of all saltwater angler trips. Marine anglers spent $944M on for-hire trips in nine coastal areas in 2022. NOAA's average for-hire spend per angler-day ranged from $169 to $760 across those areas. NOAA puts the 2023 sales impact of all marine angler trip spending at $10.1 billion, excluding boats and gear.
On the business side, 67 audited operators are offshore charters, 4% of the 1,546 audited. 75% have their own website, against 80% of all audited operators. Mean digital health is 5.15 against 5.09. And 33% show an online booking engine, against 27%.
Demand: Who Is Fishing
No public source counts offshore charter trips on their own. NOAA's Marine Recreational Information Program (MRIP) charter mode counts all for-hire boat trips, including inshore, flats and backcountry trips, and NOAA's spending figures likewise cover every kind of for-hire trip. The offshore share is smaller by an amount these data do not show.
Charter-boat trips were 1.95 million in 2021, 1.76 million in 2022, 1.89 million in 2023, 1.61 million in 2024 and 2.02 million in 2025. The report calls that a flat line with a dip, not a trend, and reads it as a market that moves with weather, fuel prices, hurricanes and the economy. NOAA recalibrated every MRIP estimate in 2026 and the report uses only the recalibrated series, so do not compare its shore and private-boat counts with older reports.
Most saltwater trips are not for-hire. In 2025, shore trips were 68% of the seven-state total of 108.7 million, private and rental boats 30% and charter boats 1.9%. Charter boats were 2.4% of trips in Alabama and 0.4% in Mississippi.
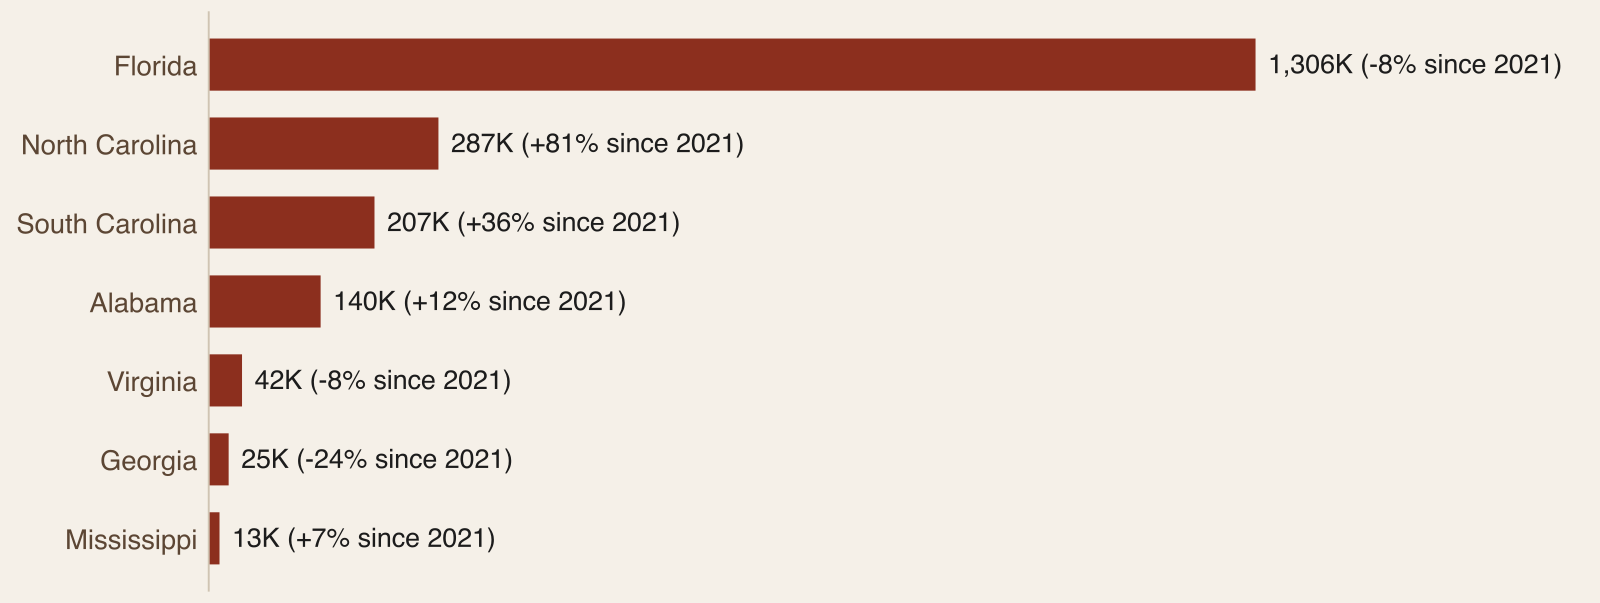
The state table shows the mix. Florida had 65.26 million trips in 2025 (42.90 million from shore, 21.05 million from private or rental boats and 1,306K on charter boats), North Carolina 14.38 million (charter 287K), South Carolina 9.55 million (207K), Virginia 6.84 million (42K), Alabama 5.78 million (140K), Georgia 3.83 million (25K) and Mississippi 3.09 million (13K). Charter share of all trips runs from 0.4% in Mississippi and 0.6% in Georgia and Virginia to 2.0% in Florida and North Carolina, 2.2% in South Carolina and 2.4% in Alabama. Since 2021, shore trips have changed +9%, private and rental boat trips +8% and charter-boat trips +3%. Headboats are excluded from MRIP, and Louisiana is not in MRIP at all because the state runs its own survey.
Charter trips concentrate. Florida's Gulf coast accounts for 49% of the seven-state total (990K). Florida's Atlantic coast (316K), North Carolina (287K) and South Carolina (207K) follow. North Carolina swings from 356K in 2023 to 131K in 2024 and 287K in 2025, and South Carolina and Alabama each reached their five-year high in 2025. Single-year state estimates are noisy, so read the moves as direction, not size.
Party boats are a data gap. MRIP does not cover headboats, which NOAA surveys separately. The one party-boat figure in the data is Virginia's: 16K trips in 2025, down from 20K in 2021. It cannot stand for the market, and the report does not size it.
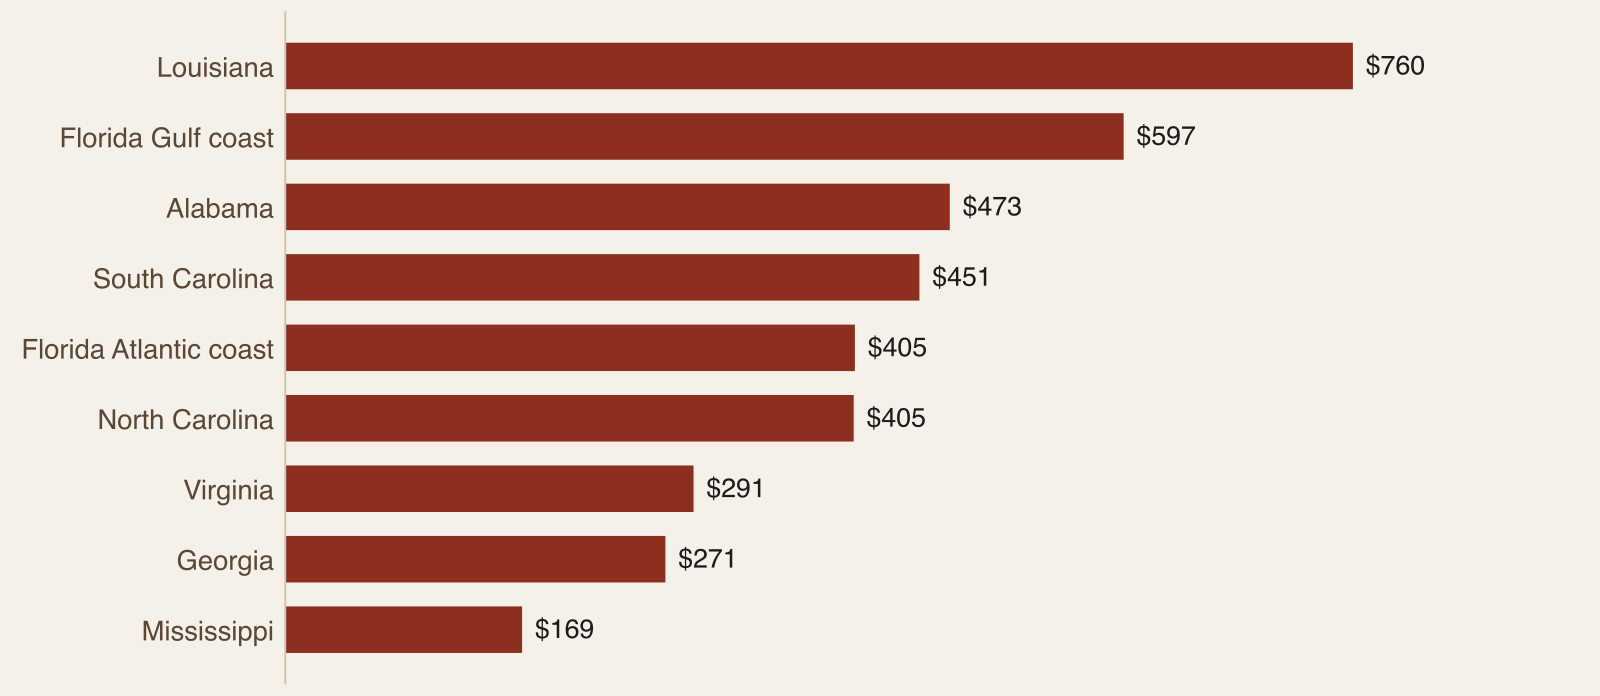
The report's most useful demand finding is spending. NOAA's 2022 study found for-hire days are the most expensive by a wide margin. Average spend per for-hire angler-day was $760 in Louisiana and $597 on Florida's Gulf coast, falling to $169 in Mississippi. Private and rental boat days ran from $31 to $309 and shore days from $9 to $136. Those are averages of what anglers reported spending on the whole trip, not prices any operator charges, and they combine every for-hire trip type.
Total for-hire trip spending was $944M in 2022. Florida's Gulf coast was largest at $559M, then Louisiana at $112M and Florida's Atlantic coast at $104M. For-hire was 24% of all marine trip spending in Louisiana and 16% on Florida's Gulf coast, against 2% in Mississippi.
The area table adds the rest of the per-day averages: Alabama $473, South Carolina $451, Florida's Atlantic coast and North Carolina $405 each, Virginia $291 and Georgia $271, with private and rental boat days from $31 to $309 and shore days from $9 to $136. For-hire spending totals were $46M in Alabama, $52M in South Carolina, $53M in North Carolina, $11M in Virginia, $6M in Georgia and $2M in Mississippi, and the for-hire share of each area's marine trip spending was 7% in Alabama and on Florida's Atlantic coast, 16% in South Carolina, 4% in North Carolina and Virginia, and 2% in Georgia and Mississippi. The report notes that these dollars come from NOAA's trip-expenditure survey and are tied to the trip counts that preceded the 2026 recalibration, so they are never divided into the recalibrated counts, and Louisiana's per-day figure is the highest in the region while its 2022 counts come from the state's own survey.
The wider economy: NOAA's 2023 edition puts the sales impact of marine angler trip spending at $10.1 billion across nine coastal areas, supporting 68,857 jobs, led by Florida's Gulf coast at $4.58 billion. Louisiana's impact fell from $590M in 2022 to $327M in 2023, which probably reflects survey inputs, so no trend should be drawn. BEA's water-based guided tours and charters line, which covers all guided water trips and not only offshore fishing, rose from $8.7 billion in 2019 to $16.9 billion in 2024, up 94%. The Coast Guard counted 3.08 million registered recreational vessels in the eight states in 2024.
Trip counts, NOAA dollars and BEA value added measure different things and are never added together.
The Resource and Where It Happens
The resource section is descriptive and carries no measured data. Offshore fishing is the fishing of open water beyond the inlets and the nearshore waters: live-bottom and reef structure, wrecks and artificial reefs, the shelf edge and, along much of the Atlantic coast, the Gulf Stream. Trips run from a few hours of nearshore bottom fishing to full days or longer. Species include dolphinfish, wahoo, tuna, king mackerel, billfish, cobia, amberjack and the snapper and grouper family, depending on the coast and season. Wind, sea state, current and water temperature decide whether a trip runs, which is why a captain's value is judgment and why cancellations are part of the business.
State waters reach a short distance offshore and the waters beyond are federal. Seasons, size and bag limits, closures and, for some species and for-hire vessels, federal permits and reporting all apply and change from year to year. A captain's website should point to the current rules and not quote them.
All 67 audited offshore operators were found in coastal sub-regions, in 15 of the 97 sub-regions. North Carolina has the most (20), followed by Florida (14) and South Carolina (8), then Louisiana (6), Virginia (6), Georgia (5), and Alabama and Mississippi (4 each). The sub-regions with the most are Outer Banks (8), then Florida Keys, Venice, Tidewater, Crystal Coast and Cape Fear (6 each). Counts follow where the sample was drawn, not the size of each state's fishery.
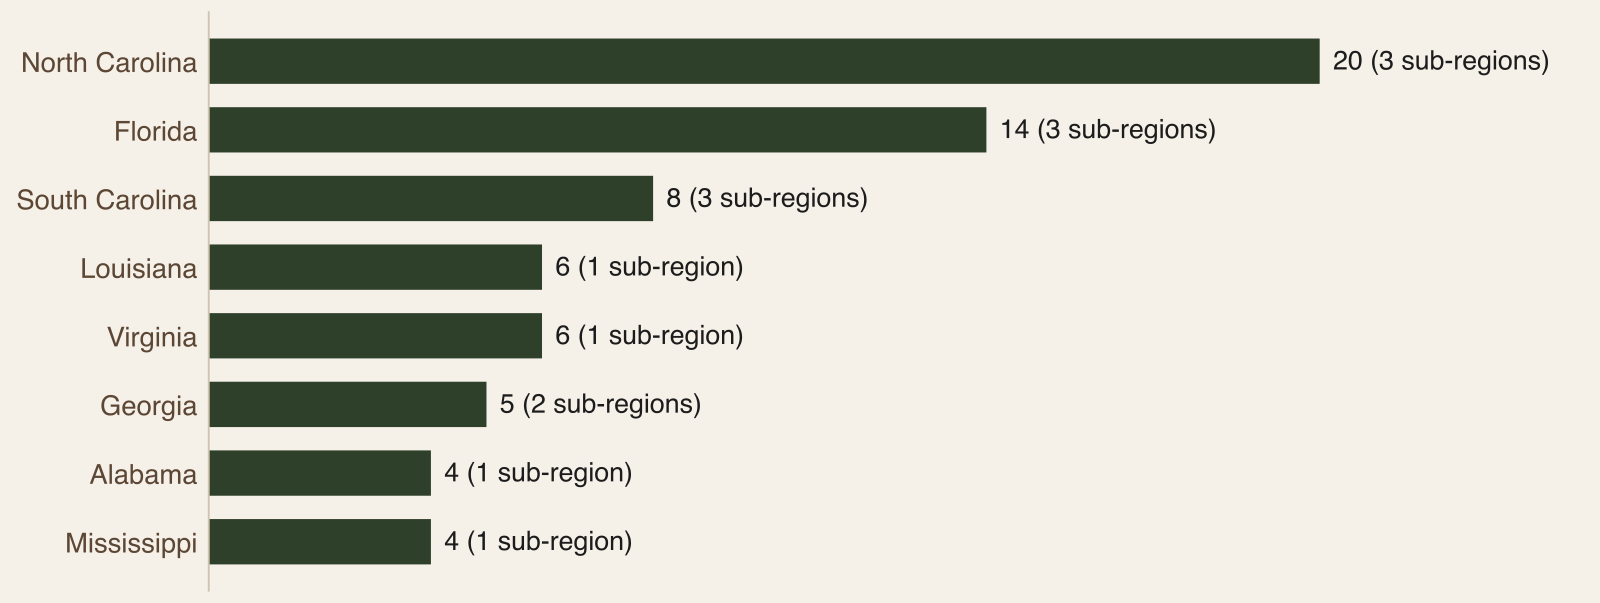
The report notes the pattern reads sensibly: Florida's two coasts and the Carolinas carry the most charter trips and for-hire spending and also have the most audited offshore operators. Louisiana has the highest average for-hire spend per angler-day but is outside MRIP because the state runs its own survey.
The state table pairs the audit counts with the NOAA columns. Coastal sub-regions with at least one offshore operator are 3 of 4 in North Carolina, 3 of 5 in Florida, 3 of 3 in South Carolina, 1 of 5 in Louisiana, 1 of 3 in Virginia, 2 of 2 in Georgia, 1 of 1 in Alabama and 1 of 2 in Mississippi, 15 of 25 in all. The report adds two cautions. A state with more audited offshore operators is not necessarily the one with the most fishing, because the audit drew about 16 operators from each sub-region. And the NOAA columns include inshore for-hire trips as well as offshore.
On rules, offshore trips usually leave from public or private marinas and run into state and federal waters. Carrying paying passengers is generally subject to vessel licensing, safety and insurance requirements, and some fisheries require federal for-hire permits. Marinas, harbors, refuges and parks add their own rules, so confirm them with the managing agency before selling trips.
The Business Landscape
Offshore charter fishing, including nearshore and blue-water charters and party boats, makes up 67 of the 1,546 audited operators (4%). A captain who runs both inshore and offshore trips may be classified in either, so the category boundary is soft.
On the basics they sit at the benchmark. Mean digital health, a 1 to 10 score our researchers assign from observed evidence, is 5.15 against 5.09. 40% score 4 or below, the same as the benchmark, and 10% score 8 or above against 12%. The weaker spot is the storefront: 75% have their own website against 80%, so about 25 in 100 are reached only through a directory, social page or booking marketplace. Against the 539 audited operators in coastal sub-regions (76% with a site, mean 5.21), the gap is smaller, so part of it is a coastal pattern.
Only North Carolina has 15 or more audited offshore operators, so states are pooled. North Carolina's 20 have a mean digital health of 5.75. The Atlantic pool (Georgia, North Carolina, South Carolina and Virginia, 39 operators) averages 5.03, with 72% having their own site. Florida (14) and the Gulf side (Alabama, Louisiana and Mississippi, 14) are too small to show in numbers, and the report treats them as gaps in the evidence and not findings.
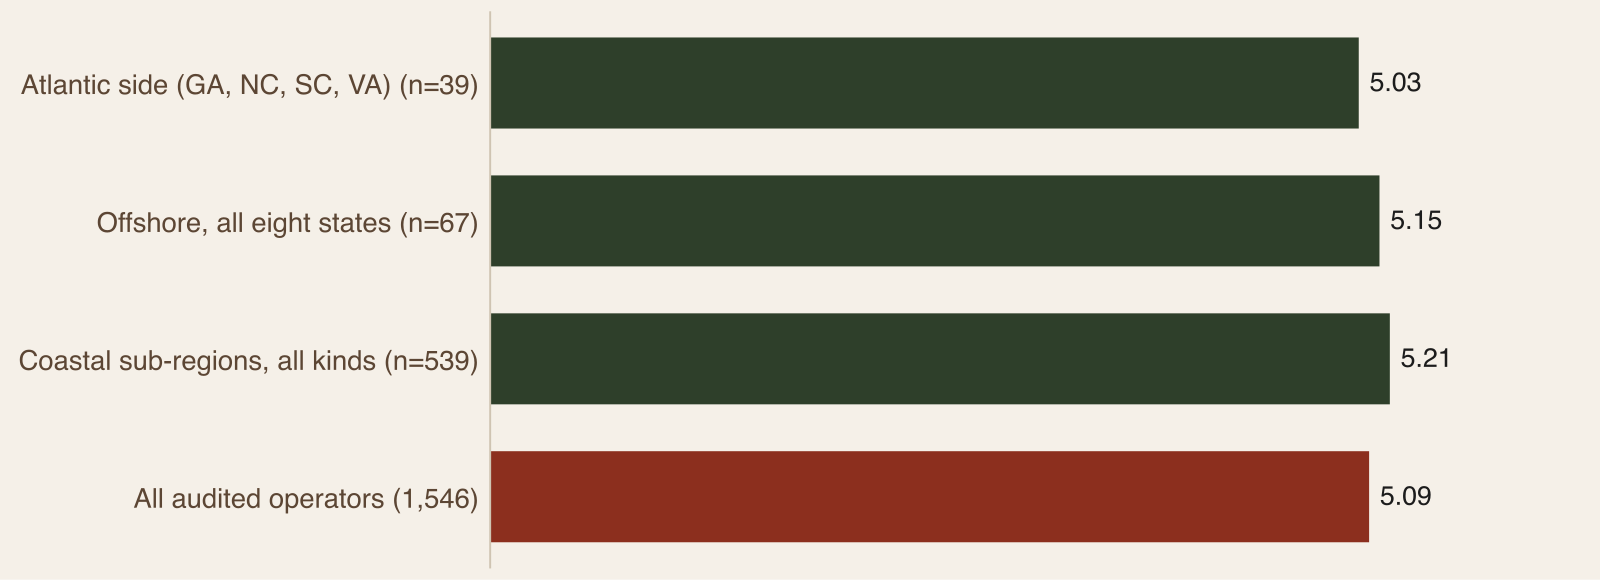
The pooled table adds the detail. The Atlantic side has 23 sites read and 46% of its operators score 4 or below, and Florida and the Gulf side have 13 and 7 sites read. The comparison set of all 539 audited operators in coastal sub-regions has 76% with their own website, a mean of 5.21 and 37% scoring 4 or below, so part of the offshore storefront gap is a coastal pattern. By state, in words: Georgia has 5 audited offshore operators, Virginia 6, South Carolina 8, Louisiana 6 and Alabama and Mississippi 4 each, and the report treats these as gaps in the evidence and not findings, ranking no state below 15.
How Buyers Search and Book
The audit sees a homepage, not a search. As general guidance, an offshore buyer is planning a trip around a vacation or a milestone, often for a group, and treats it as a larger purchase than a day close to home. They look for how long the trip runs, which boat and how many it carries, what is included, whether the group can book the whole boat or a seat, and what happens if the weather cancels.
Of the 67 operators, 43 had a homepage that could be read. From those sites:
33% show an online booking engine, against 27% overall and 37% in the coastal subset. 14 sites show one, and 12 of them use FareHarbor. That fits fixed trips, seats and boat charters sold by date. It also means 67% show no booking path.
49% carry FAQ content, against 37% overall. But only 2 of 43 mark it up as FAQ structured data, even though 70% have some structured data.
23% offer a newsletter signup, against 33%.
36% of sites with a detectable copyright year show 2023 or earlier, against 25%.
The pattern is a storefront that is ahead on booking and answers and behind on email and freshness. For a business whose customers return and whose days depend on weather, the report calls an email list the cheapest way to fill open dates.
The Atlantic pool is the only pool with enough sites to show on its own, from 23 sites read: 26% show online booking, 52% carry FAQ content, 1 site (4%) marks it up as structured data, 22% offer a newsletter signup, 65% have some structured data and 27% of sites with a detectable year show 2023 or earlier. The coastal subset, from 354 sites, shows 37%, 41%, 7 sites (2%), 28%, 71% and 26% on the same measures. State-level booking rates are not shown, because no state but North Carolina has both 15 or more operators and 10 or more sites read, and the audit records which booking platform appears and not how it is set up. Sites that blocked automated requests or timed out are excluded rather than guessed, and all rates are lower bounds.
The Season and Booking Calendar
The calendar is general guidance, not audit or public data, and the best calendar is your own. Warm-season demand is the broad shape, but offshore fishing follows the water and the rules: sea state, current, temperature, the run of each species and the seasons set by regulators. The report runs five phases.
Winter: visitors ask about spring and summer trips and what seasonal species run, and many boats are in the yard or fishing nearshore. Publish next season's dates, boats, trip lengths and what each includes, post the weather and cancellation policy, and test the booking path end to end.
Spring: vacation planners book the summer and groups look for dates. Post a "what is running now" note and a conditions page, confirm licenses, federal and state permits, safety checks and insurance, and email last year's guests with open dates.
Summer: peak demand along most coasts, with buyers booking close to the date from a phone. Show live availability and the earliest open date, answer messages the same day and ask every group for a review.
Fall: many coastal fisheries have a peak, but hurricane season can cancel or move trips. Publish a clear storm and rebooking policy and email past guests before the best dates fill.
Year-round: species, seasons and closures differ by coast, by species and by whether the water is state or federal, so keep a dated current conditions and rules page.
The report also separates buyers. Vacation groups plan weeks or months ahead and book the whole boat, so they need early dates, boat capacity and trip lengths. Party-boat and seat buyers book individual seats, often a few days ahead, and want a clear schedule, what is included and a seat-level booking path. Local and repeat anglers decide close to the date and rebook when reminded. Corporate and special events inquire early and need a quote, a boat count and sometimes a deposit. To build your own calendar, list your dates, pull the last two seasons of bookings to see how far ahead each type of group booked, whole-boat or seat, and write your wind, sea state, storm and rebooking policy once.
Six Moves for Operators
The report closes with six moves. For the marketing playbook, see Marketing a Saltwater Charter Fishing Business in the Southeast.
Own your storefront. 75% of audited offshore operators have their own website, against 80% overall. A site of your own is where search, reviews and booking come together, and it cannot be taken away by a directory or a platform.
Keep the booking path, and put it first. 33% of offshore sites read show a booking engine, ahead of the 27% benchmark, but 67% show none. A visible check-dates button that works on a phone, for a whole boat or a seat, turns a call you cannot answer at sea into a booking.
Publish the answers, and mark them up. 49% of offshore homepages have FAQ content, but only 2 of 43 sites read use FAQ structured data. Answer boat and group size, trip length, seasickness, what to bring, license rules and weather, in structured form.
Write a page for each trip, species and port. A page per trip type, per major species and per departure port, written from your own logs and photos, gives search engines and buyers something specific to find.
Build a list and use it. 23% of offshore sites offer a newsletter signup, against 33% overall. Remind past guests when dates go up, and send the fall and spring openings before they fill.
Date everything, and keep it fresh. 36% of sites with a detectable year show 2023 or earlier. Show current rules, conditions and the season on the page with a date, and update the homepage year and photos each season.
What the Report Cannot Tell You
There is no offshore-only measure. MRIP's charter mode and NOAA's for-hire spending cover every kind of for-hire trip, so the figures describe the for-hire saltwater market and not offshore trips alone.
The party-boat market is not sized. MRIP does not cover headboats, and the only figure used is Virginia's small party-boat mode.
Spend per angler-day figures are NOAA survey averages of reported spending in 2022 dollars. They are not prices, they are not adjusted to 2026, and they combine every for-hire trip type.
NOAA recalibrated every MRIP estimate in 2026, MRIP does not publish Louisiana, and charter estimates for one state and one year can be considerably noisier than the 4% to 8% standard errors of the state totals.
The audit is a structured sample of about 16 operators per sub-region, not a census, and the category boundaries with inshore and general guiding are soft.
What It Means for Operators
For-hire is where the money per angler is, but the market is small and moves with weather. Charter boats are 1.9% of trips, the count has been flat with a dip, and Florida's Gulf coast holds nearly half. Plan for a market that swings, with a cancellation and rebooking policy shown before checkout.
The NOAA spending averages show how much anglers spend on a for-hire day compared with a shore or private-boat day, which supports presenting the trip as a considered purchase: the boat, the crew, what is included and what to expect. They are angler spending averages, not prices, so do not use them to price a trip.
The storefront shows where to put effort. Booking and answers are already ahead of the benchmark, so the gains are in structured answers, a list and fresh dates, plus a site of your own for the one in four who rely on a directory.
Get the Report
The full report adds the MRIP state tables, the NOAA for-hire spending tables, the audit tables and a methodology chapter with data gaps and sources. If you can only do one thing this month, the report's advice is to make sure a visitor can find your homepage, see the boat and what a trip includes, and hold a date from a phone in under a minute.
Download the full 2026-27 Saltwater Offshore report (free with your email).
Frequently Asked Questions
How many charter fishing trips happen in the Southeast?
In 2025 charter boats made an estimated 2.02 million trips across seven MRIP states, up 3% from 1.95 million in 2021 and 1.9% of all saltwater trips. Florida's Gulf coast alone had 990K, 49% of the total. That count includes inshore as well as offshore charters, Louisiana is outside MRIP, and the path was 1.76 million in 2022, 1.89 million in 2023 and 1.61 million in 2024, a flat line with a dip and not a trend.
How much do anglers spend on a for-hire trip?
NOAA's 2022 survey puts average spending per for-hire angler-day between $169 in Mississippi and $760 in Louisiana, with $597 on Florida's Gulf coast and $473 in Alabama, against $31 to $309 for private and rental boat days and $9 to $136 for shore days. These are averages of what anglers reported spending on the whole trip, in 2022 dollars, and they cover every for-hire trip type. They are not prices any operator charges.
Where is for-hire spending concentrated?
Mostly on Florida's Gulf coast. Marine anglers spent $944M on for-hire trips across nine coastal areas in 2022, and Florida's Gulf coast was largest at $559M, then Louisiana at $112M and Florida's Atlantic coast at $104M. For-hire was 24% of all marine trip spending in Louisiana and 16% on Florida's Gulf coast, against 2% in Mississippi. The wider 2023 sales impact of all trip spending was $10.1 billion, supporting 68,857 jobs.
Does the report size the party-boat market?
No. MRIP does not cover headboats, which NOAA surveys separately. The only party-boat figure is Virginia's 16K trips in 2025, down from 20K in 2021, which cannot stand for the market. The report states the party-boat market as a data gap, so operators who sell seats should use their own booking records, and the seat-level booking path advice in the six moves.
How many offshore operators did the audit find, and where?
The audit found 67 offshore charter operators, 4% of the 1,546 audited, in 15 of the 97 sub-regions. North Carolina has 20, Florida 14 and South Carolina 8, with 4 to 6 in each other coastal state, and the Outer Banks is the largest sub-region at 8. The audit sampled about 16 operators per sub-region, so counts follow where the sample was drawn, and a captain who runs inshore and offshore trips may be classified in either category.
Why are offshore operators pooled by region?
The offshore category is small, at 67 audited operators, and only North Carolina has 15 or more. States are pooled into an Atlantic side (Georgia, North Carolina, South Carolina and Virginia, 39 operators), Florida (14) and a Gulf side (Alabama, Louisiana and Mississippi, 14), and only the Atlantic pool is large enough to show in numbers. Groups that are still too small are described in words, and differences under about half a point of score are noise at these sizes.
How do offshore captains' websites compare with other operators?
On the basics they sit at the benchmark: mean digital health 5.15 against 5.09, and 40% score 4 or below, the same as the benchmark. They are ahead on booking (33% against 27%) and FAQ content (49% against 37%), and behind on email (23% against 33%) and freshness, with 36% of sites showing a copyright year of 2023 or earlier against 25%. Only 2 of 43 sites mark up FAQ content as structured data.
What permits does an offshore charter need?
The report does not list them. It says carrying paying passengers is generally subject to vessel licensing, safety and insurance requirements, that some fisheries require federal for-hire permits, and that marinas, harbors, refuges and parks add their own rules. State waters reach a short distance offshore and the waters beyond are federal, so rules differ by agency, state and place. Confirm with the managing agency before selling trips.
Sources
NOAA Fisheries, Marine Recreational Information Program estimate data, recalibrated series posted August 31, 2026 (2021 to 2025)
NOAA Fisheries, Fisheries Economics of the United States, 2022 and 2023 editions, and the 2022 study of economic contribution of marine angler expenditures
U.S. Coast Guard, Recreational Boating Statistics, 2024, registered recreational vessels by state
U.S. Bureau of Economic Analysis, Outdoor Recreation Satellite Account, November 2024 release (2023 data) and March 2026 release (2024 data)
Pine & Marsh Southeast audit, October 2026 (1,546 operators in 97 sub-regions)


Comments