
Inside the 2026-27 Southeast Outdoor Economy Report: What 11 States Say About Hunters, Anglers and Visitors
The State of the Southeast Outdoor Economy, 2026-27 Edition, is Pine & Marsh's annual look at what hunting, fishing, boating and the outdoors are worth across Alabama, Arkansas, Florida, Georgia, Kentucky, Louisiana, Mississippi, North Carolina, South Carolina, Tennessee and Virginia. It pairs public, primary-source data from the Bureau of Economic Analysis, the U.S. Fish and Wildlife Service, NOAA Fisheries and state tourism offices with our own verified audit of 1,546 private outdoor operators. Every figure in it carries a source and a data year.
It is written for people who run guide services, lodges, charters, preserves and outdoor hospitality businesses, and for anyone deciding where to put marketing effort next season. This post walks through the report one chapter at a time. For the marketing playbook built on the audit, see The State of Outdoor Marketing in the Southeast: 2026-27 Data From 1,546 Verified Outfitter Audits.
The Southeast at a Glance
The report opens with nine numbers. The 11 states produced $176.7B in outdoor recreation value added in 2024, which is 25.4% of the U.S. total, and outdoor recreation employed 1.43 million people. In 6 of the 11 states, outdoor recreation is a larger share of GDP than the U.S. average of 2.4%.
The people side is just as lopsided. The region had 4.71M paid hunting license holders and 8.87M paid fishing license holders in license year 2024. That is 29.9% and 29.8% of the national totals, from a region with 25.7% of the nation's people. Add 108.7 million marine angler trips in 2025, $37.6B in angler spending and $15.1B in hunter spending (both 2022), and the Southeast stands out as an outdoor region, not just a pretty one.
The Economy
The Bureau of Economic Analysis measures outdoor recreation the same way in every state, which makes it the best state-by-state yardstick. Florida is the region's outdoor economy by a wide margin: $65.3B in 2024, more than three times the next state, Georgia, at $20.7B. Outdoor recreation is also 3.8% of Florida's GDP, the highest share in the region.
BEA value added counts the outdoor share of many industries, including retail, manufacturing, accommodation, food service and transportation, plus the activities themselves. Behind Florida ($65.3B) and Georgia ($20.7B) come North Carolina ($17.8B), Tennessee ($15.6B), Virginia ($14.4B), South Carolina ($10.2B), Louisiana ($10.0B), Alabama ($7.3B), Kentucky ($6.4B), Arkansas ($5.0B) and Mississippi ($4.2B). Jobs follow the same order at the top, from 509K in Florida to 37K in Mississippi. For an operator, the practical use is context: your state's number tells you how large the outdoor economy around you is, and the GDP share tells you how much your state's economy leans on it.
Size and intensity tell different stories. Louisiana (3.0%), South Carolina and Tennessee (2.8% each), Mississippi (2.7%) and Arkansas (2.6%) lean on the outdoors more than the national average of 2.4%. Virginia (1.9%) and North Carolina (2.1%) have large outdoor economies sitting inside even larger state economies.
The chapter ends with a warning that matters for anyone quoting these numbers. BEA value added, tourism visitor spending and the hunting and fishing spending studies all measure different things and overlap, so the report never adds them together. Southwick Associates' 2022 estimates put angler spending across the 11 states at $37.6 billion and hunter spending at $15.1 billion.
The People: Hunters and Anglers
In license year 2024 the 11 states counted 4,714,399 paid hunting license holders and 8,867,909 paid fishing license holders. Hunters and anglers paid $204 million and $222 million for those licenses, tags and permits.
Density varies. Arkansas has the most hunters and anglers per resident in the region, at 10.7 hunting and 17.2 fishing license holders per 100 residents, followed by Tennessee, Louisiana and Alabama. Florida is the largest fishing market by headcount, with 1,728,223 license holders, but has the fewest hunting license holders per resident.
Counts by state show where the hunters are. Georgia has the most hunting license holders at 816K, followed by Tennessee (734K), North Carolina (582K), Alabama (497K), Louisiana (451K), Arkansas (331K), Kentucky (316K), Mississippi (272K), Florida (265K), Virginia (251K) and South Carolina (199K). The per-resident ratios include nonresident buyers, which raises the figures in destination states, and license-exempt hunters and anglers, such as some landowners, youth and seniors, are not counted.
The trend is the more useful finding. Regional hunting license holders were up 1.1% from 2020 to 2024, while fishing license holders peaked in 2021 and were 4.6% below that peak by 2024. Hunting is holding and fishing is cooling.
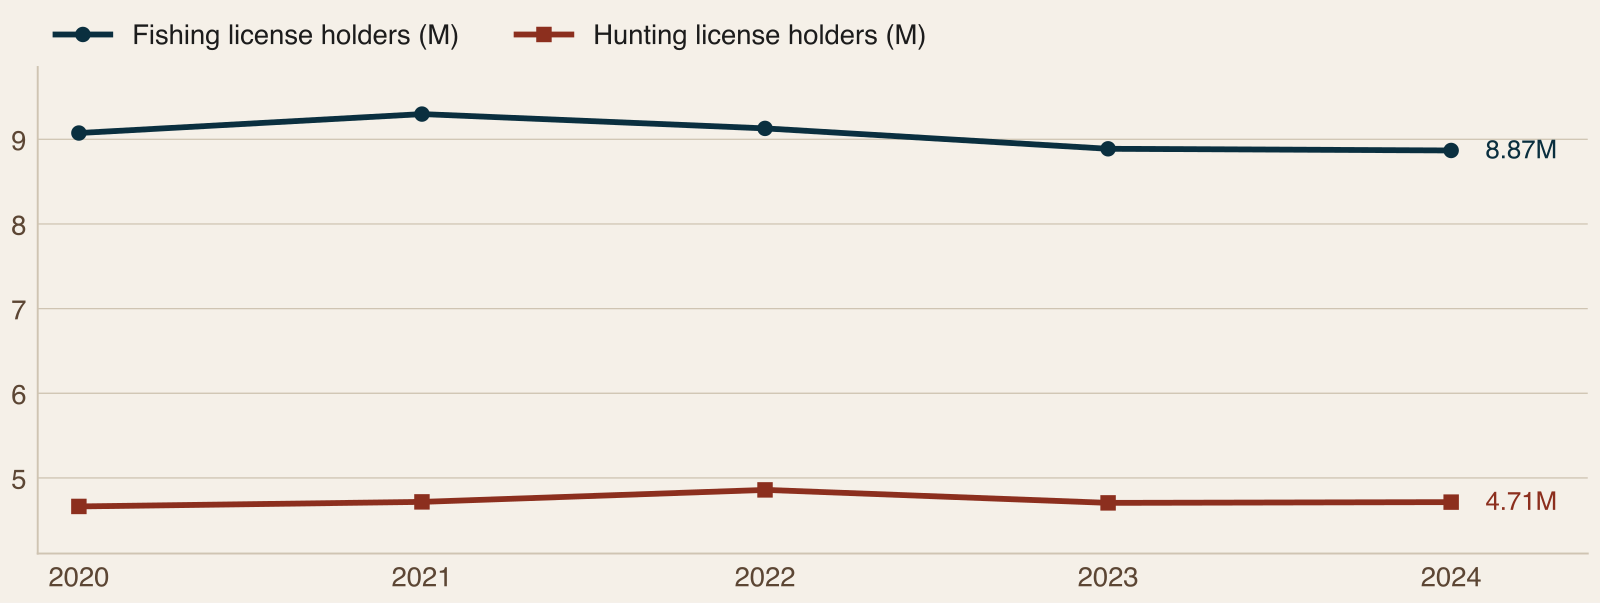
Where hunters live is shifting, too. Florida (up 30.3%) and Georgia (up 9.3%) gained hunting license holders from 2020 to 2024, while North Carolina (down 8.2%) and Alabama (down 6.4%) lost the most. On the fishing side, Louisiana was down 13.8% and South Carolina down 11.8%. Two cautions come with the data. License holders are not unique people, because someone licensed in two states counts twice, and some swings, including Tennessee's 2022 hunting count and Florida's 2023 and 2024 hunting counts, likely reflect reporting changes.
The full state table adds the rest of the picture. Hunting license holders also rose in Tennessee (up 3.4%), Kentucky (up 3.3%) and Louisiana (up 2.7%), and fell in Mississippi (down 5.0%), South Carolina (down 4.6%), Arkansas (down 3.1%) and Virginia (down 2.5%). On fishing, Florida (up 8.3%), Georgia (up 6.0%), Kentucky (up 3.7%) and Tennessee (up 0.5%) grew, while North Carolina (down 9.1%), Virginia (down 7.1%), Arkansas (down 6.2%), Mississippi (down 3.9%) and Alabama (down 3.0%) shrank alongside Louisiana and South Carolina.
The Resource: Deer, Turkey, Waterfowl, Dove and Quail
This chapter reports what the agencies count, and the picture is mixed.
Federal duck limits are now set in a memorandum every three years rather than through annual rulemaking, so the 2026-27 frameworks for the Atlantic and Mississippi flyways also permit up to four mallards (two hens) and three pintails inside the six-duck bag. Arkansas also leads the region's goose harvest.
Waterfowl: the 2026 breeding survey counted 33.4 million ducks, about 6% below the long-term average. Mallards were the concern at 5.9 million, down 11% from 2025 and 26% below average, and northern pintails were 48% below average. The 2026-27 frameworks for the Atlantic and Mississippi flyways still allow a 60-day season with a six-duck daily bag.
Deer: Virginia (227,302, preliminary) and North Carolina (199,770) reached five-season highs in 2025-26. Arkansas was down 7% from its 2024-25 record. States count harvest differently, so the report tells you to compare trends within a state, not totals across states. Mississippi has no mandatory reporting and no recent agency total.
Turkey: spring 2026 brought record or near-record harvests in Kentucky (36,439), North Carolina (25,034, the highest since records began in 1977), Louisiana (4,024) and Arkansas (13,591, the most since 2006). The longer story is recruitment: most states reported fewer than two poults per hen, the level Alabama and South Carolina treat as sustainable.
Doves, quail and hogs: Eastern Management Unit doves numbered about 82.5 million in 2025, roughly flat since 2018 but down from 97.3 million in 2007. Wild bobwhite remain far below historic levels, with Georgia's index down more than 75% since 1966 and Tennessee's more than 90% since the 1960s. Feral swine cause at least $3.4 billion a year in damage nationally, according to USDA APHIS.
Arkansas and Louisiana together account for about 2.66 million ducks a season, nearly as many as the other nine states combined at 2.74 million. Survey methods changed in 2023, so recent harvest highs partly reflect the new method and should not be read as a trend.
Deer harvest by state, from the report's table, shows why the chapter warns against ranking states. Virginia (227,302, preliminary) and North Carolina (199,770) reached five-season highs in 2025-26. Tennessee (153,294) fell from 167,986, and Kentucky (145,433) slipped from 149,868 but is up from 132,322 in 2021-22. Georgia harvested about 250,000, below its 298,022 peak in 2023-24, and Louisiana's survey estimate rose to 276,200 from 239,000. South Carolina (190,707 in 2024) was down 4%, Alabama (205,913 in Game Check, 2024-25) was up from 201,518, and Florida's survey estimate of 113,629 compares with 65,707 in 2020-21. Mourning doves in the Eastern Management Unit were taken at 5.48 million in 2025-26, up 5.6%, with a 90-day season and 15 birds a day, and Georgia leads the region's dove harvest. Several states have cut turkey bag limits or delayed openers since 2023, and nine of the eleven states are eligible for the 2026 round of the federal Feral Swine Eradication and Control Pilot Program.
The Water: Saltwater Angling and Boating
NOAA's Marine Recreational Information Program estimates saltwater fishing effort for every coastal state except Louisiana, which runs its own LA Creel survey. Marine angler trips across the seven MRIP states rose from 100.0 million in 2021 to 108.7 million in 2025. NOAA recalibrated the full series in August 2026, so these counts are lower than figures published before then and should not be compared with them.
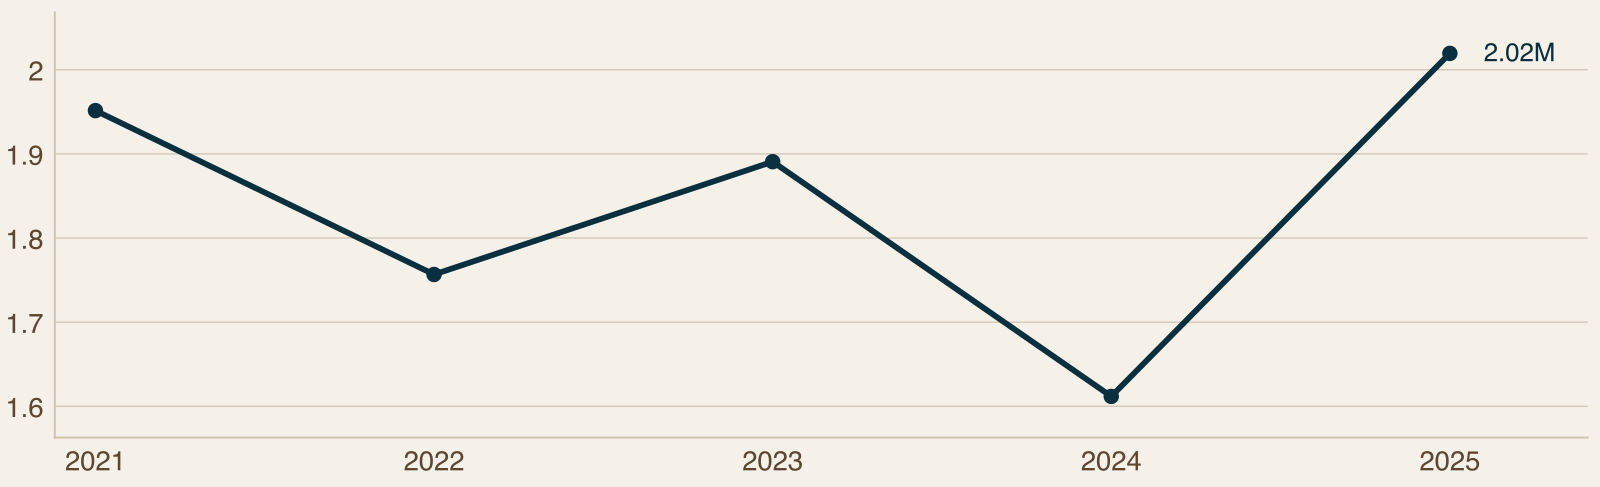
Charter-boat angler trips reached 2.02 million in 2025, the highest of the last five years. Charter anglers also spend the most. NOAA's 2022 survey put for-hire spending per angler-day at $760 in Louisiana and $597 on Florida's Gulf coast, several times what shore anglers spend. One caution: NOAA's economic figures were built on pre-recalibration trip counts, so do not divide them by the new trip estimates.
The report also carries NOAA's 2023 economic-impact figures for trip spending, in sales and jobs, and cautions that Louisiana's 2023 numbers fell sharply from 2022, likely reflecting changes in LA Creel inputs. Read the economic series on their own terms, never as a per-trip average.
The Wider Market: Visitors
Every first-time guest of a guide, lodge or rental arrives as a visitor first. State tourism offices report visitor spending from $10.2 billion to $46.2 billion per state in the latest year. Because the studies use different contractors and definitions, the report advises reading each figure within its own state and not ranking states against each other. The point is scale: this is the traveling public your business competes with, online, alongside every other attraction.
Visitor spending is the figure that dwarfs license revenue in every state, and the report's takeaway is that first-time guests are the audience a guide, lodge or rental has to reach online.
How Travelers Find Outfitters Now
This is where our audit comes in. We rebuilt and re-verified it for this edition: every business was confirmed real and operating in October 2026, and every website was read by the same script on the same day. The result is a structured sample of 1,546 private, for-profit operators, about 16 per sub-region across 97 sub-regions. State parks, public agencies and nonprofits are excluded.
The scan read homepage HTML on October 17, 2026. Of the 80% of operators with a website, 1,093 returned a page and are counted. Because only homepages are read, every rate here is a lower bound. The chapter also notes how discovery is changing: search engines increasingly answer questions directly on the results page, and AI assistants answer trip-planning questions in full sentences, citing a handful of sources. Only about one in fifty sites mark up their answers in the structured format those systems read most easily.
The headline numbers:
80% have their own website, rather than a Facebook page or marketplace listing only.
The mean digital health score is 5.09 out of 10, and 40% score 4 or below.
37% have any FAQ content on the homepage, but only 2.0% of 1,093 sites checked mark up their answers with FAQ structured data.
33% offer a newsletter or email signup.
27% let guests book online from the homepage.
The pattern is consistent from the Gulf to the Blue Ridge. Most businesses have a working, secure, mobile-friendly site, and few have built the layer that turns a website into an answer: specific, structured, current information about their water, their season and their trips. About a quarter of sites still show a copyright year of 2023 or earlier. Rates are lower bounds, because a feature may exist deeper in a site, and no business is named in the report.
Eleven States, Side by Side
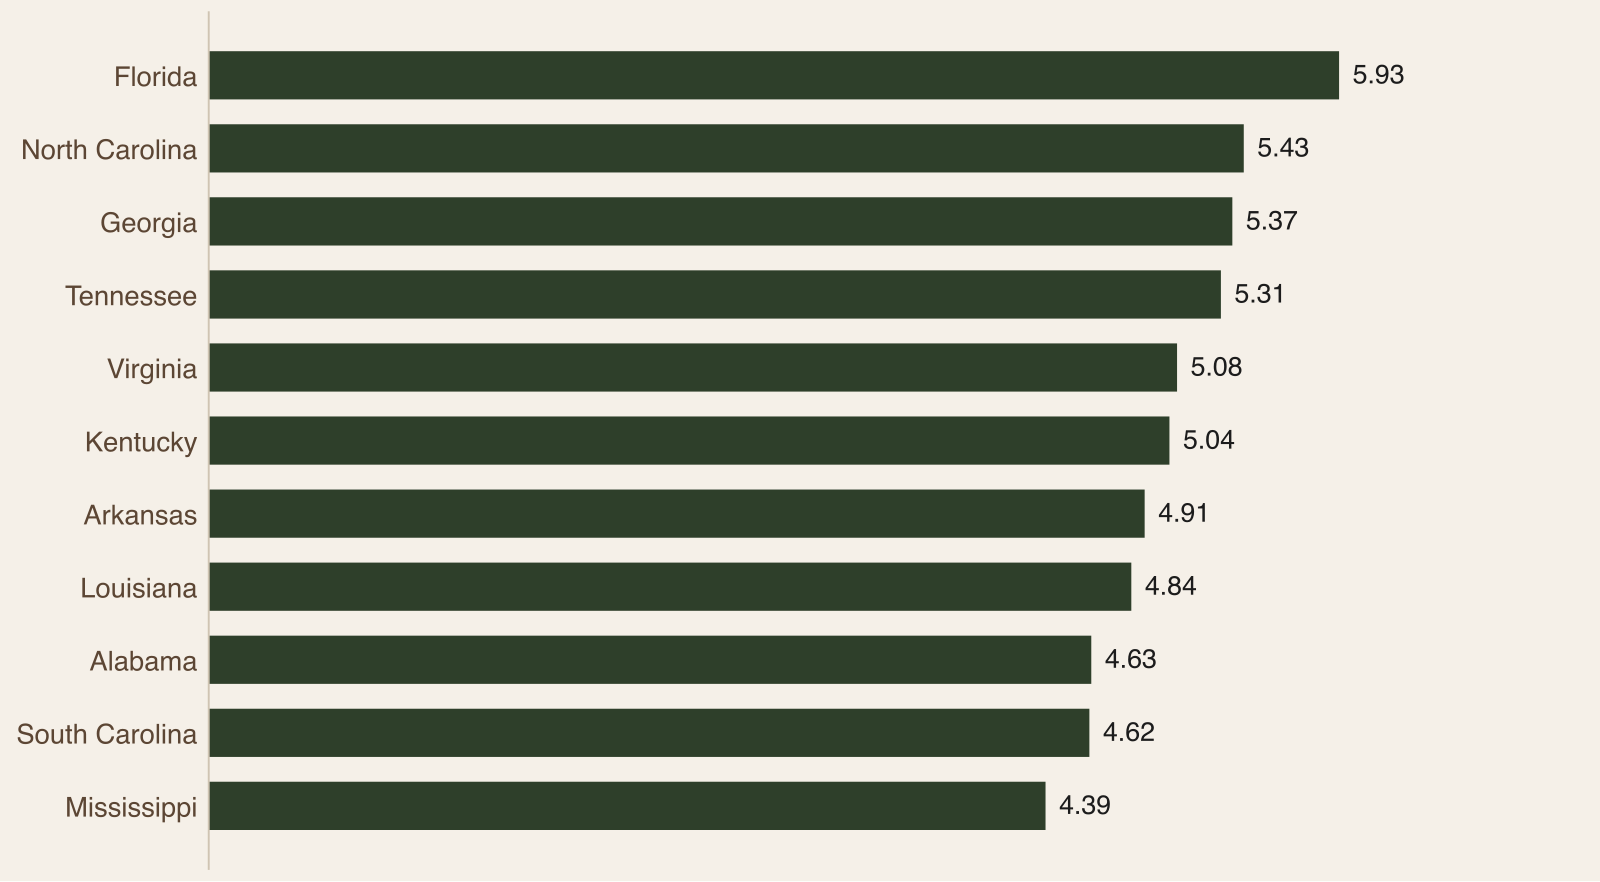
The state snapshots give each state's value added, jobs, and hunting and fishing license holders with the change since 2020. A few contrasts stand out. Florida has 509K outdoor recreation jobs against Mississippi's 37K. Georgia has 816K hunting license holders and Tennessee 734K. North Carolina has 1,318K fishing license holders but lost 9.1% of them since 2020. Florida gained 8.3% in fishing license holders over the same period, and Virginia lost 7.1%.
Treat the snapshots as a way to find your own state's numbers quickly, and then read the chapters above for the context behind them.
A few more of the snapshot figures show the range. Alabama has $7.3B in outdoor recreation value added (2.2% of state GDP) and 72K jobs. Arkansas has $5.0B (2.6%) and 43K jobs, Georgia $20.7B (2.3%) and 168K jobs, and Virginia $14.4B (1.9%) and 126K jobs. Louisiana's $10.0B is 3.0% of its GDP, but its fishing license holders fell 13.8% since 2020. Kentucky's hunting (316K, up 3.3%) and fishing (528K, up 3.7%) license holders both grew.
What It Means for Operators
The report closes with six takeaways, and the common thread is that the market is large and the gap is in how businesses present themselves.
Plan around the license calendar, not just the season. A state's hunter and angler base is the first market to reach every year, and it is measurable.
Treat saltwater and charter demand as a growth market. Charter trips hit a five-year high, and charter anglers spend the most per day.
Write for the traveler, not only the regular. First-time guests search with plain questions: when to come, what to bring, where to stay, what it costs to get licensed.
Own the answers about your water and your season. Specific, current, well-structured information is what search and AI answers are built from.
Mind the rules on public land and water. Commercial guiding on wildlife management areas, national wildlife refuges and national forests is restricted or permit-based in much of the region, so confirm with the managing agency before you advertise any public-land trip.
Measure what you can. License data, tourism data and your own booking records together tell you where next year's guests will come from.
Read the Full Southeast Outdoor Economy Report
Every chart, state snapshot, source and caveat is in the full report.
Download the full 2026-27 Southeast Outdoor Economy report (free with your email).
Frequently Asked Questions
How big is the outdoor economy in the Southeast?
The Bureau of Economic Analysis put outdoor recreation value added across the 11 states at $176.7B in 2024, 25.4% of the U.S. total, with 1.43 million outdoor recreation jobs. Florida alone produced $65.3B, more than three times Georgia's $20.7B. In 6 of the 11 states (Arkansas, Florida, Louisiana, Mississippi, South Carolina and Tennessee), outdoor recreation is a larger share of GDP than the U.S. average of 2.4%. Florida's 3.8% is the highest in the region.
Are hunting and fishing participation growing in the Southeast?
Hunting is holding and fishing is cooling. Regional hunting license holders were up 1.1% from 2020 to 2024, while fishing license holders peaked in 2021 and were 4.6% below that peak by 2024. Florida (up 30.3%) and Georgia (up 9.3%) gained hunters, while North Carolina (down 8.2%) and Alabama (down 6.4%) lost the most. License holders are not unique people, so these are trends in licenses, not headcounts.
Why does the report never add its economic figures together?
BEA value added, tourism visitor spending and the hunting and fishing spending studies measure different things and overlap. Adding them would count the same trips more than once, so the report shows each on its own terms with its source and year. Southwick Associates' 2022 estimates put angler spending at $37.6 billion and hunter spending at $15.1 billion across the 11 states, and state tourism offices report visitor spending from $10.2 billion to $46.2 billion per state.
What does the audit say about operator websites?
Across 1,546 verified private operators, the mean digital health score is 5.09 out of 10 and 40% score 4 or below. Only 2.0% of 1,093 sites checked use FAQ structured data, 37% have any FAQ content, 33% offer a newsletter signup and 27% let guests book online from the homepage. Rates are lower bounds, because the scan reads homepages only and a feature may exist deeper in a site. No business is named in the report.
What is the outlook for ducks, turkeys and deer?
The picture is mixed. The 2026 breeding survey counted 33.4 million ducks, about 6% below the long-term average, with mallards 26% below average and pintails 48% below. Spring 2026 turkey harvests set records or near-records in Kentucky, North Carolina, Louisiana and Arkansas, but most states reported fewer than two poults per hen. Deer harvests reached five-season highs in Virginia and North Carolina. States count harvest differently, so compare trends within a state, not totals across states.
Is saltwater and charter fishing growing?
Yes, according to NOAA's recalibrated series. Marine angler trips across the seven MRIP states rose from 100.0 million in 2021 to 108.7 million in 2025, and charter-boat angler trips reached 2.02 million, the highest of the last five years. NOAA's 2022 survey put for-hire spending per angler-day at $760 in Louisiana and $597 on Florida's Gulf coast. Because NOAA recalibrated in August 2026, counts are lower than figures published before then and should not be compared with them.
How current are the report's numbers?
Data years differ by source, and each chart lists its own. BEA figures are for 2024, license data for license year 2024, NOAA trip estimates for 2025, NOAA economic figures for 2023, tourism figures mostly 2025, and angler and hunter spending for 2022. The audit was verified in October 2026, with website signals read on October 17, 2026. Because the years differ, the report advises reading each figure on its own terms and not combining them.
Is it legal to guide on public land in the Southeast?
It depends on the land and the managing agency. The report notes that commercial guiding on wildlife management areas, national wildlife refuges and national forests is restricted or permit-based in much of the region. National forests need a U.S. Forest Service special-use permit, and National Park Service units need a commercial use authorization or concession contract. Confirm with the managing agency before you advertise any public-land trip.
Sources
U.S. Bureau of Economic Analysis, Outdoor Recreation Satellite Account, March 5, 2026 release (2024 data)
U.S. Fish and Wildlife Service, Wildlife and Sport Fish Restoration Program, paid license certification data, license years 2020 to 2024
NOAA Fisheries, Marine Recreational Information Program, 2021 to 2025 estimates, recalibrated series released August 31, 2026
U.S. Census Bureau, State population estimates, Vintage 2025
USDA APHIS National Feral Swine Damage Management Program, Southwick Associates studies for the American Sportfishing Association and the Sportsmen's Alliance Foundation (2022 data), state wildlife agency harvest reports, state tourism office visitor-spending reports (2024 and 2025), and the Pine & Marsh Southeast audit, October 2026 (1,546 operators), as cited in the report
## Related Reading
- The State of Outdoor Marketing in the Southeast: 2026-27 Data From 1,546 Verified Outfitter Audits
Related Reading
The State of Outdoor Marketing in the Southeast: 2026-27 Data From 1,546 Verified Outfitter Audits
Inside the 2026-27 Whitetail Report: Why You Cannot Rank Deer Harvest by State
Inside the 2026-27 Waterfowl Report: Hunters, Breeding Numbers and the Duck Guide Storefront
Inside the 2026-27 Sporting Lodges Report: What Each Chapter Found


Comments