
Inside the 2026-27 Sporting Lodges Report: What Each Chapter Found
The 2026-27 Sporting Lodges and Multi-Program Destinations report is the eleventh in our industry series. It covers the lodges, plantations, ranches and multi-species hunting properties of 11 Southeastern states, and it pairs public demand data with our October 2026 audit of 493 hunting businesses, 199 of which fall into what we call the lodge group.
This post is a chapter-by-chapter tour for owners, managers and marketers who want to know what is behind the headline numbers before they download the full report. For the overview and what to fix first, see Sporting Lodges and Multi-Program Destinations: Nonresident Demand and How Groups Book. Here, we go table by table.
At a Glance: What the Opening Page Counts
The first chapter reduces the report to nine numbers and a one-line thesis: a lodge sells a stay, a set of hunts and often a shoot as one trip, to out-of-state groups who decide on what the website tells them.
The numbers split into three families. Demand figures come from federal sources: 4.58 million nonresident hunting licenses, tags, permits and stamps sold in the U.S. in 2024, 11.7% of the 39.1 million total, with 22% of those sold in the 11 states. Economy figures come from BEA, at $16.5 billion of national value added from hunting, shooting and trapping in 2024. Everything else is audit data: 199 operators, a mean digital health score of 5.67, and the three website gaps of 7% booking, 23% FAQ content and 35% stale copyright years.
The executive summary then makes the report's most important admission. No source counts lodge guests, revenue, rooms or package prices, so the report never sizes the lodge market. If you see a lodge market figure attributed to this report, it did not come from here.
Demand: Nonresident Hunters and the Travel Economy
This is the data-heaviest chapter, and it works from the outside in. It starts with the hunting base: the 2022 National Survey counted 14,374,589 U.S. hunters age 16 and older, who spent 241 million days afield on 165 million trips. The 11 states had 4,714,399 paid hunting license holders in 2024, 30% of the U.S. total.
The core table then lists nonresident licenses, tags, permits and stamps by state. Three details stand out.
Georgia sold the most nonresident products in absolute terms, 195,292, but they were only 12% of its hunting sales and up 24% from 2020.
Arkansas and Kentucky lean hardest on travelers: 163,321 products at 34% and 135,518 at 24%, with Kentucky up 20% on 2020. Arkansas is the only state with a count of people, about 127,000 nonresident hunters against about 270,000 residents in 2022, or roughly 32% of those hunting.
The movers are Florida, up 98% from 2020 from a small base of 35,961, and North Carolina, down 29% to 19,377. Tennessee and North Carolina swing sharply between years for reasons the source does not give, so the report attributes no cause.
Across all 11 states the sum is up 16% against 2020, against 11% for the U.S., though the figure counts products and not hunters.
The chapter then adds three overlapping spending measures: hunting spending of $45.2 billion in 2022, of which $12.3 billion (27%) was trip-related; BEA accommodation and food services value added in outdoor recreation of $97.7 billion in 2024, 14% of the $697 billion total; and state visitor spending across all travel. A state table puts them side by side. North Carolina leads on 2022 hunting spending at $2.1 billion, and Florida leads on the other two. The report never adds them, since they describe the same trips from different angles.
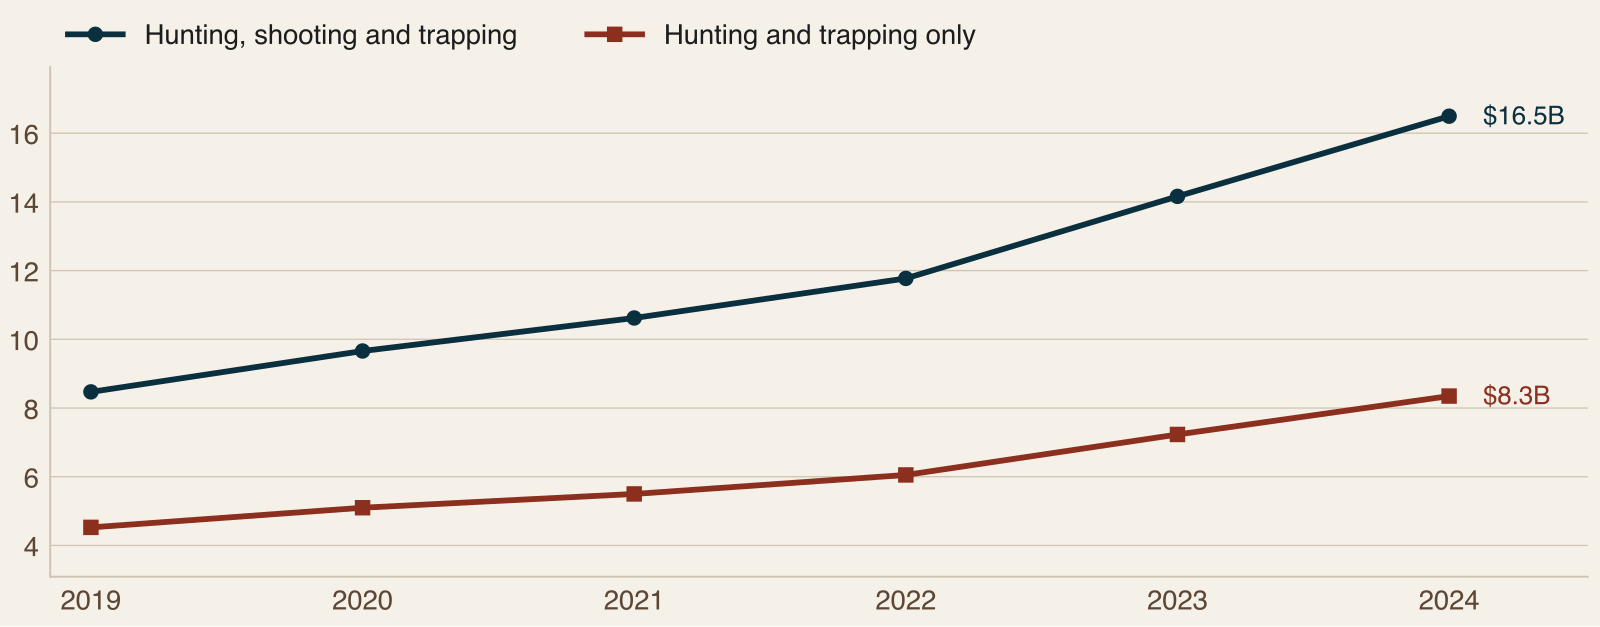
BEA's hunting line is the economy around the lodge. Value added from hunting, shooting and trapping rose from $8.5 billion in 2019 to $16.5 billion in 2024, up 95% in current dollars, which includes price increases. Hunting and trapping alone was $8.3 billion and shooting, including archery, was a separate $8.1 billion. The total is 2.4% of the $697 billion BEA measures for all outdoor recreation. These are national totals, not lodges.
The state spending table shows how different the three measures look side by side. North Carolina's hunting spending in 2022 was $2.1 billion, with $2.5 billion of accommodation and food value added in outdoor recreation in 2024. Georgia was $2.0 billion and $2.4 billion, Tennessee $2.0 billion and $3.3 billion, and Kentucky $1.6 billion and $1.1 billion. Florida's hunting spending was $971 million against $11.8 billion of accommodation and food value added. Visitor spending covers all travel and its definitions differ by state, so read it with care: Florida's $134.9 billion counts out-of-state visitors only, and South Carolina's $23.8 billion is direct travel spending.
Two of the volatile series deserve a closer look. Tennessee's nonresident count rose from 45,259 in 2020 to 171,230 in 2022 and fell to 73,078 in 2024. North Carolina's fell from 31,753 in 2023 to 19,377 in 2024. The source gives no reason for either, and the report attributes no cause. Louisiana's nonresident count was down 11% from 2020, the other decline besides North Carolina's 29%.
What a Sporting Lodge Sells
This short chapter is general description, not data, and it is where the report defines the product. It breaks the bundle into six parts: a place to stay, guided hunts, shooting, other days on the property, food and hospitality, and hosting a group. For each it names what a website needs to show, such as capacity and arrival details for the stay, a page per program for the hunts, and minimums with a named contact for a group.
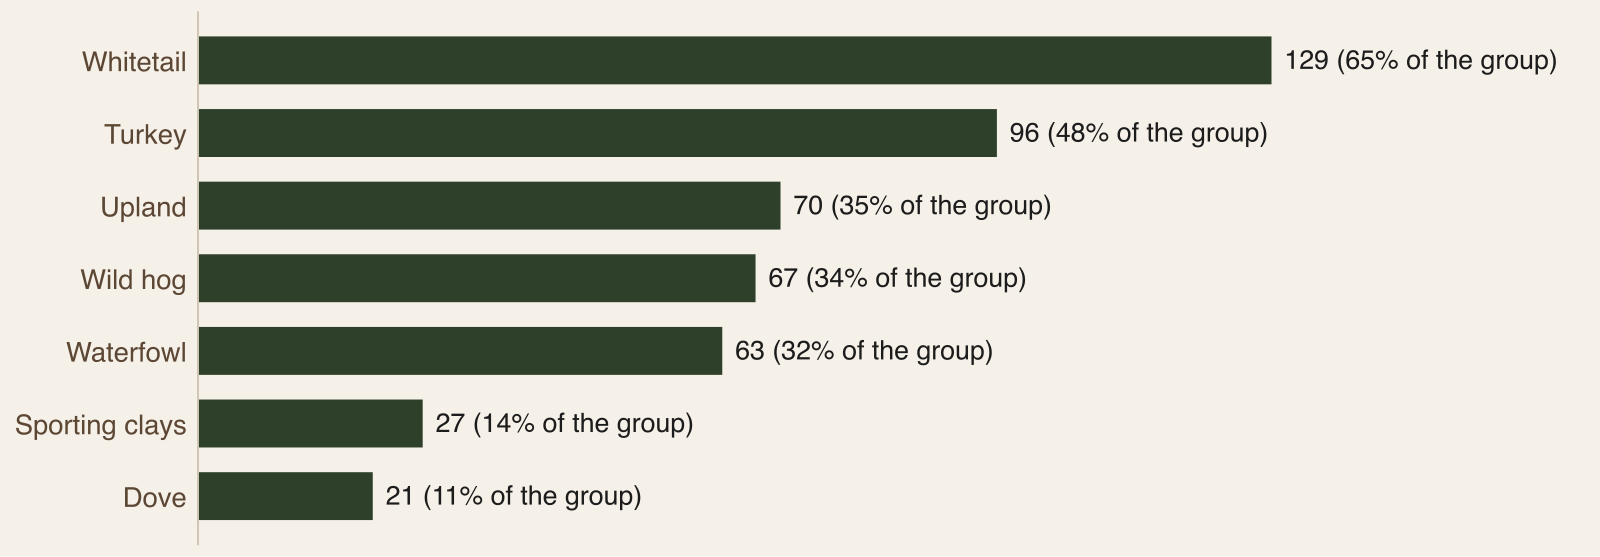
The audit sees the bundle only through game tags. Of the 199 members, 9 carry no game tag, 44 carry one, 146 (73%) carry two or more and 95 (48%) carry three or more. Whitetail leads at 129 operators, then turkey at 96. Rooms, meals and non-hunting activities are real parts of the product but are not recorded in the audit.
The chapter closes with a short rules note. Programs on a lodge's own land follow state seasons and license rules, and shooting preserves operate under state preserve licenses. Public-land hunts follow each managing agency's rules, and commercial guiding there generally requires a permit or special-use authorization. Confirm with the managing agency before advertising one.
The six-part table is the most practical page in the chapter for a website owner. A place to stay needs capacity, what is included, arrival and departure and what the stay looks like. Guided hunts need each program on its own page with seasons, party size and what a day looks like. Shooting needs what is offered, for whom and whether it is open to day visitors. Other days on the property need a plain list of what is on site, so a family or a mixed party can see its own days. Food and hospitality need photos and a short description, since this is part of the reason people book a lodge. Hosting a group needs a group page with capacity, minimums, a quick inquiry form and a named contact.
Where It Happens
The audit finds lodge group operators in every state, led by Alabama (32), Kentucky (29) and South Carolina (25). Those three hold 86 of the 199 (43%), and the top five, adding Georgia and Tennessee, hold 124 (62%).
Read the state table in two directions. As a share of each state's audited hunting operators, the lodge group is largest in Kentucky (76%), South Carolina (62%) and Alabama (48%), and smallest in North Carolina (21%). But nonresident license shares run in a different order, highest in Arkansas, Kentucky and Mississippi. Arkansas has 12 lodge group operators and the highest nonresident share at 34%, while Alabama has the most operators and an 8% share.
The report's explanation is modest. The audit finds operators that could be verified, and license data count all nonresident sales, including hunters who stay with relatives, on leased land or in a rented house. The data do not show where nonresident hunters sleep. Several states also fell short of the audit's target, so counts reflect what researchers could verify and not market share.
The state table adds a second ratio. The lodge group is 48% of Alabama's audited hunting operators, 76% of Kentucky's, 62% of South Carolina's, 32% of Georgia's, 36% of Tennessee's, 32% of Louisiana's, 41% of Mississippi's, 39% of Florida's, 21% of North Carolina's, 32% of Arkansas's and 36% of Virginia's. The six states with fewer than 15 audited lodge group operators are Arkansas (12), Florida (13), Louisiana (14), Mississippi (14), North Carolina (13) and Virginia (9), 75 combined, which is why the next chapter pools them. Every state has at least 9 in the group.
The Business Landscape
This chapter defines the lodge group and scores it. A record is in the group if it is tagged as a lodge (163 operators) or carries three or more species tags and no lodge tag (36 operators). It is our grouping of audit records, not an official category, and a business is in it whether it calls itself a lodge, a ranch, a plantation or a club.
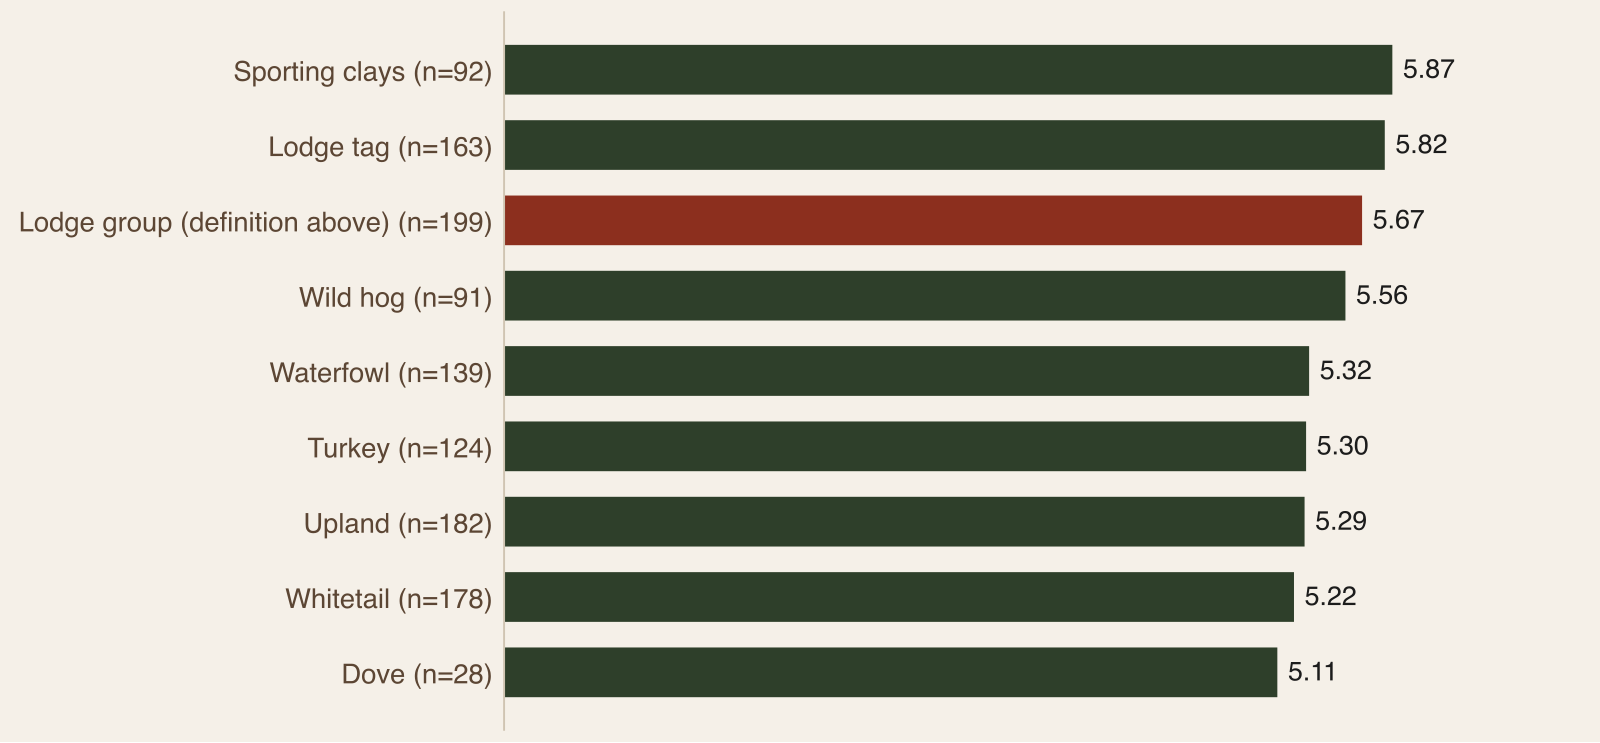
Compared with others, the group has a website at a higher rate (98%), and 25% score 4 or below on digital health, against 34% for all hunting operators. The 294 hunting operators outside the group average 4.93, which is why the group's 5.67 stands out. The report is careful to say the audit cannot explain why.
Two details are easy to miss:
The two parts differ. Lodge-tagged operators score 5.82 and the 36 multi-species operators score 5.00, with 44% of the second part at 4 or below. Newsletter signup is 29% against 11%.
State scores vary more than the headline suggests. Georgia averages 6.73 and Tennessee 6.06 among the five states with enough operators to describe, while Alabama averages 5.28, South Carolina 5.32 and Kentucky 5.45. Georgia also has the highest booking rate at 14%, and South Carolina the stalest sites, with 50% showing a copyright year of 2023 or earlier. The six small states, pooled, average 5.65.
The report's caution applies here: differences under about 10 percentage points, or half a point of score, are noise at these sample sizes, and even the largest state rests on 32 sites read.
The sample behind the numbers is worth knowing. The 493 hunting businesses are 314 newly verified in October 2026 and 179 hunting-related operators from the larger Southeast audit, and the 199 in the lodge group are 180 from the new audit and 19 from the Southeast audit. Every business was confirmed as operating before it was included: dead, parked and hijacked sites were dropped, and in some states about half of the directory candidates were excluded this way.
The comparison table has four rows. The lodge group (199) has 98% on their own website and a mean of 5.67, with 25% scoring 4 or below and 192 sites read. Hunting operators outside the group (294) have 93% on their own website, a mean of 4.93 and 41% scoring 4 or below. All 493 audited hunting operators average 5.23 with 95% on their own website and 34% at 4 or below, and the Southeast benchmark of 1,546 has 80.2%, 5.09 and 39.8%. The benchmark covers all outdoor business types, so comparisons with it are indicative.
For the six small states pooled, the 75 operators average 5.65, 99% have their own website, 30% of sites read carry FAQ content and 6% show online booking. In the five states shown separately, Alabama's 32 sites read average 5.28, Kentucky's 29 average 5.45, South Carolina's 25 average 5.32, Georgia's 22 average 6.73 and Tennessee's 14 sites read average 6.06.
How Buyers Search and Book
The audit shows what is on a homepage, not how buyers search, so this chapter has two halves. The first is guidance, a table of four buyers (a corporate host, a family or reunion, a hunting party and a planner or assistant), each with what they are working out and what the site should answer. The second is measurement.
On measurement, the 192 lodge sites read show 7% with an online booking engine (14 sites), 23% with FAQ content, and 3 with FAQ structured data, even though 62% have some structured data, usually added by website builders. Newsletter signup is 26%, against 32.7% in the benchmark. The report notes that a low booking rate is no surprise for trips arranged by quote, and that the audit does not record inquiry forms or group pages, so every rate is a lower bound.
The comparison table puts the lodge group beside the other groups. Of the 192 lodge sites read, 7% show a booking engine, 23% carry FAQ content, 2% carry FAQ structured data, 26% offer a newsletter signup, 62% have any structured data and 35% show a copyright year of 2023 or older. The 257 hunting sites outside the group show 9%, 26%, 0%, 28%, 60% and 30%. The Southeast benchmark of 1,093 sites shows 27.0%, 36.9%, 2.0%, 32.7%, 66.9% and 25.0%. In other words, the lodge group is level with other hunting operators and behind the benchmark on booking and answers.
Many of the sites that show structured data got it automatically from website builders, which is why 62% have some and only 3 mark up their FAQ. The report states that rates are of sites read, are lower bounds, and use sites with a detectable year for the copyright figure.
The Year: A General Calendar
The calendar is guidance, not data, and gives no season dates. It runs four phases. In spring and summer, corporate and reunion planners choose destinations for the fall and winter. Late summer and early fall is when hunting parties settle dates and out-of-state buyers choose. The main seasons fill in layers as several programs run at once, and late season and winter is the time for thank-yous, rebooking and off-season group days.
A second table sets out how four kinds of guest book, from the corporate group that needs a quote and a deposit to the returning guest who rebooks when reminded. The chapter ends with a four-step exercise: list your dates, mark your lead times from the last two seasons of bookings, schedule content ahead of them, and write your cancellation and weather policy once.
The actions the report suggests for each phase are specific. In spring and summer, publish next season's programs, group options and policies, send past guests and group hosts their first look at dates, and refresh stale text and the copyright year. In late summer and early fall, open a waiting list and send it to past guests first, post each program's season dates as soon as the state publishes them, put availability and a deposit or date-hold step on the booking page, and update the FAQ for current license requirements. In the main seasons, keep availability current, answer messages the same day, share honest reports and ask every party for a review. In late season and winter, offer returning guests first choice of next year's dates and promote any off-season group days.
The pattern holds even where dates differ: most of the selling is done before a season starts, group and family buyers decide earlier than hunting parties, and the best-informed buyers book when state dates are announced. The best calendar is your own.
Six Moves for Operators
The report's closing chapter converts findings into moves: sell the trip and not just the hunt, build a page for groups, make it possible to book or hold a date online, answer questions and mark them up, show it is current, and keep a list and use it. Its single starting point is to put the stay, the programs, the season's dates and a way to ask about a group on the homepage, then add a short FAQ from your last ten callers.
Each move has a number. Sell the trip: 146 of 199 carry two or more game programs. Book or hold a date: 7% of 192 sites show an engine against 27.0%. Answer and mark up: 23% against 36.9%, and 3 of 192. Show it is current: 35% against 25.0%. Keep a list: 26% against 32.7%. The single starting point is to put the stay, the programs, the season's dates and a way to ask about a group or hold a date on the homepage, and make it work on a phone. Hold the licenses and permits your operation requires, and say so.
What It Means for Operators
Three things come out of reading all nine chapters together. First, you will not find a lodge market number, and you should be suspicious of anyone who offers one. Demand is the traveling pool, and your own booking records are the only measure of your share.
Second, the lodge group is stronger online than other hunting operators and weaker than the regional benchmark where it matters for a trip sold by the night: booking, answers and freshness. That pattern is consistent across states, though Georgia is a visible exception on score.
Third, the report is honest about what it cannot see. Scanner rates are floors, state samples are small, and the groups overlap. Treat it as a map of where to look in your own site and records.
Read the Full Sporting Lodges Report
The full report has the state-by-state tables, the spending comparison, the audit by state, the buyer and booking tables, the calendar and the sources and methods for every chart.
Download the full 2026-27 Sporting Lodges and Multi-Program Destinations report (free with your email).
Frequently Asked Questions
Does the Sporting Lodges report estimate how many lodges there are?
No. It defines a lodge group of 199 audited operators, 163 tagged as lodges and 36 multi-species operators with three or more game tags and no lodge tag, but that is a Pine & Marsh grouping of audit records in a verified sample. It is not an official category and not a count of every lodge. A business is in the group because of how it is tagged, whether it calls itself a lodge, a ranch, a plantation or a club, and the audit did not record rooms, meals or capacity.
Which states depend most on nonresident hunters?
By share of hunting licenses, tags, permits and stamps sold in 2024, Arkansas (34%), Kentucky (24%) and Mississippi (22%). By volume, Georgia sold the most at 195,292. Florida's count was up 98% from 2020 from a small base, while North Carolina's was down 29%. Tennessee and North Carolina swing sharply between years for reasons the source does not give, so read those two with care. These are products sold, not people, and they cannot be tied to lodge stays.
How does the lodge group score online by state?
Among the five states with enough operators to describe, Georgia averages 6.73, Tennessee 6.06, Kentucky 5.45, South Carolina 5.32 and Alabama 5.28. The six smaller states pooled average 5.65. Georgia also has the highest booking rate at 14%, and South Carolina the stalest sites, with 50% showing a copyright year of 2023 or older. Differences under half a point are noise at these sample sizes, and even the largest state rests on 32 sites read.
Is the 40% figure a share of all lodges in the Southeast?
No. 199 of the 493 audited hunting operators (40%) fall into the lodge group. That is a share of the audit sample, not of the lodge industry, and the audit is a sample of operators we could verify, not a census. In some states about half of the directory candidates were excluded because the sites were dead, parked or hijacked, and several states fell short of the audit's target, so counts reflect what researchers could verify and not market share.
Can a lodge advertise a guided hunt on a wildlife management area or a national forest?
Only with the right authorization. Commercial guiding on public land generally requires a permit or special-use authorization from the managing agency. Programs on a lodge's own land follow state seasons and license rules, and shooting preserves operate under state preserve licenses. Confirm with the managing agency and your state wildlife agency before advertising a public-land hunt, and never advertise a public-land hunt without the permit for that unit.
What does the audit say about lodge booking and answers?
Of the 192 lodge sites read, 7% show an online booking engine, 23% carry FAQ content and 3 mark answers up as FAQ structured data, against 27.0%, 36.9% and 2.0% in the benchmark. Newsletter signup is 26%, against 32.7%, and 35% of sites with a detectable year show 2023 or older, against 25.0%. All of these are lower bounds, because the scanner reads only the homepage and does not record inquiry forms or group pages.
How big is the hunting economy around lodges?
BEA value added from hunting, shooting and trapping reached $16.5 billion in 2024, up 95% from $8.5 billion in 2019 in current dollars. Hunting and trapping alone was $8.3 billion and shooting, including archery, $8.1 billion. U.S. hunting spending was $45.2 billion in 2022, of which $12.3 billion (27%) was trip-related. These measures overlap and are never added together, and none of them is lodge revenue, since no source collected counts lodge guests, revenue or room counts.
What should a lodge fix first?
Put the stay, the programs, the season's dates and a way to ask about a group or hold a date on the homepage, and make it work on a phone. Then add a short FAQ built from the questions your last ten callers asked and mark it up. After that, build a group page with capacity, minimums, sample itineraries, what is included and a named contact, and refresh dates, photos and the footer each season. Returning guests and past group hosts are the cheapest bookings, so keep a list and use it.
Sources
U.S. Fish and Wildlife Service, certified hunting license data and Wildlife and Sport Fish Restoration Program, license years 2020 to 2024
2022 National Survey of Fishing, Hunting, and Wildlife-Associated Recreation, U.S. Fish and Wildlife Service (2022 survey conducted by NORC at the University of Chicago), including the Arkansas Game and Fish Commission state tabulation
U.S. Bureau of Economic Analysis, Outdoor Recreation Satellite Account, March 2026 release (2019 to 2024) and November 2024 release (2023 state data)
U.S. Census Bureau, population estimates, used with the license data
Southwick Associates for the Sportsmen's Alliance Foundation, Economic Impact of Hunting and Shooting in America (2022 data) and state tourism office reports for the 11 states (2024 and 2025), as cited in the report
Pine & Marsh hunting audit, October 2026 (493 operators), and the Pine & Marsh Southeast audit, October 2026 (1,546 operators), used as the benchmark
Related Reading
Sporting Lodges and Multi-Program Destinations: Nonresident Demand and How Groups Book
Inside the 2026-27 Outdoor Hospitality Report: State Tables, Lodging Types and Guest Calendars
Inside the 2026-27 Sporting Clays and Shooting Report: Shooters Outnumber Hunters 2.1 to One
Inside the 2026-27 Upland and Quail Report: Scarce Wild Birds, 182 Operators and the Booking Gap


Comments